Inglés (pdf)
 Articulo en XML
 Referencias del artículo
 Enviar articulo por email
 Citado por SciELO
  Similares en
SciELO
Similares en
SciELO 
 Permalink
1. Global perspectives of agriculture
Agriculture has allowed the large-scale development of society since the Neolithic. It has permanently increased its scale and complexity by incorporating new technologies and responding to world demands.
According to Trigo, Mateo & Falconi (2011), since the nineties, after a long period of separatist policies on agriculture and few incentives for research worldwide, it has been possible to start reassessing it as a source of economic contribution and its relation to environmental and social problems (such as those related to food security) that arise from its development. According to IADB (Trigo, Mateo & Falconi, 2011) there are three medium-term challenges: a 70% increase of food demand, detriment of natural resources, as well as climate change effects and high prices of fossil fuels.
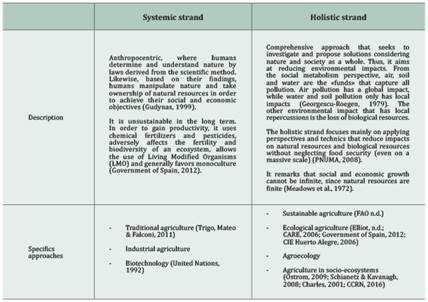
Different tools, derived from conventional to holistic approaches, are used to solve agricultural problems of the twenty-first century. Those approaches could be divided into two relevant strands: the systemic and the holistic strands.
2. MuSIASEM Methodology
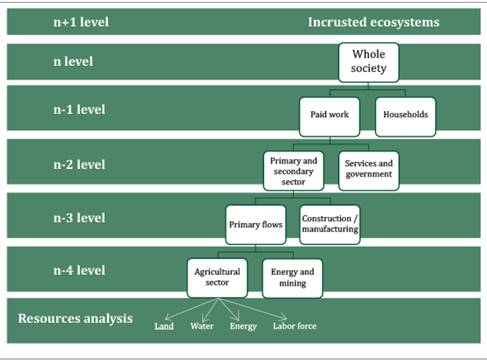
The Multi-Scale Integrated Analysis of Societal and Ecosystem Metabolism (MuSIASEM) allows underlining the system patterns of socioeconomic metabolism, characterizing them in different stages. In particular, it focuses on performance characterization of economic activities (for households, enterprises, economic sectors and national economies) and associated ecological restrictions (Giampetro et al., 2009). In few words, this methodology allows analyzing sustainability of economic activities organized in a multi- level structure and scales, and it represents this hierarchical structure. First, it is society as a whole, at «n» level of analysis. Second, at n-1 level, society is divided into paid labor and households. Since households are only consumers, there is not another level of analysis for this compartment. However, at n-2 level paid labor is divided into labor in the primary and secondary sectors, and the government and service sector. At the n-3 level of analysis, the productive sectors are divided into primary flows sector and construction / manufacturing. The n-4 level of analysis focuses only on extractive activities of natural resources, such as agriculture, mining and energy. Thus, the agricultura sector is conceived as part of a hierarchical structure of society. Transformed resources could be analyzed per sector, at every level, or as a whole.
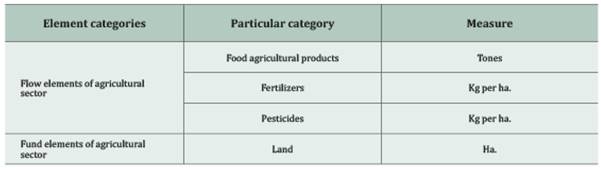
Based on the Flow and Fund model of applied economics (Georgescu-Roegen, 1979) and social metabolism, agricultural production is classified into two categories: flow elements, which could be transformed into a system; and fund elements, which are stable and transform flow elements1.
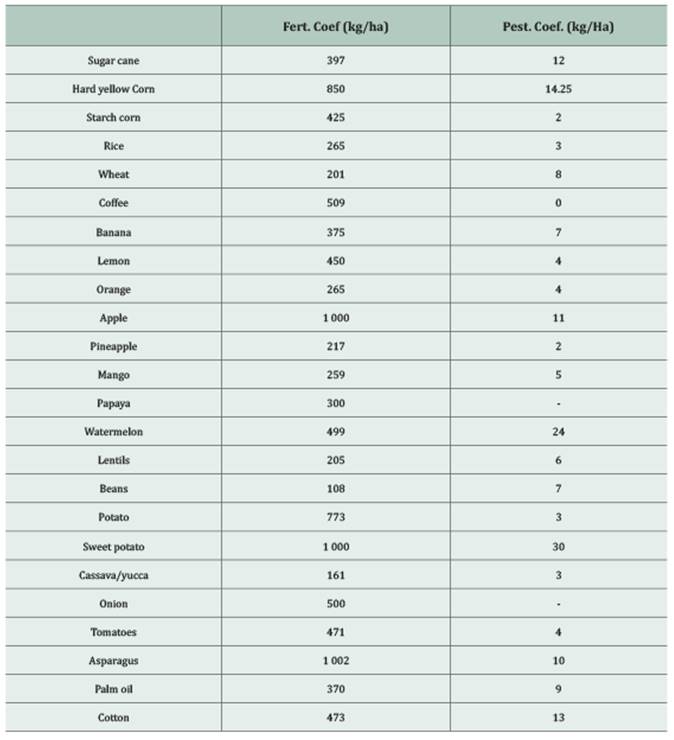
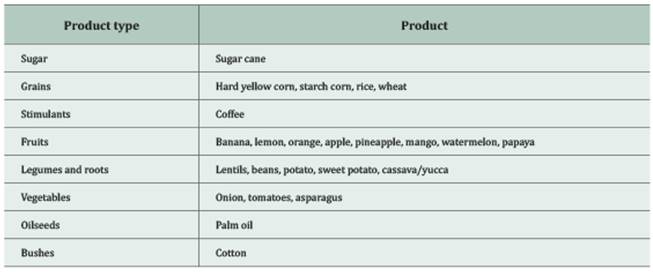
According to Cadillo (2015), to estimate the use of fertilizers and pesticides, it is necessary to select 8 types of crops2, as described in the following table. Afterwards, once we have measured production and land use, we use specific coefficients3 to quantify the amount of fertilizers and pesticides.
3. Results
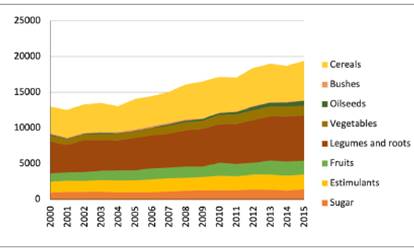
From 2000 to 2015 agricultural production grew 2% and the use of the land 1% (Minagri, 2018). In 2015, total production of agricultural products reached 19 373 tons, for which 2 444 827 hectares of land were used. The main products were grains, legumes and roots, fruits and stimulants over this period.
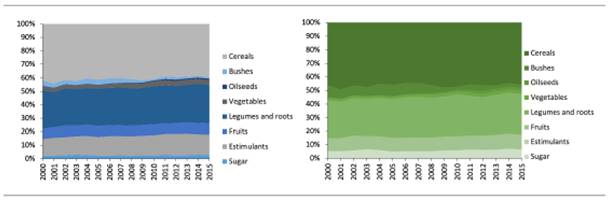
In 2015, total chemical fertilizer used reached 1261 kilotons and pesticides amounted to 15.7 kilotons. They grew 1% and 0.7%, respectively, from 2000 to 2015. Over 70% of fertilizers and pesticides were used for grains, legumes and roots. Stimulants, such as coffee, used a larger share of chemical fertilizers than of pesticides.
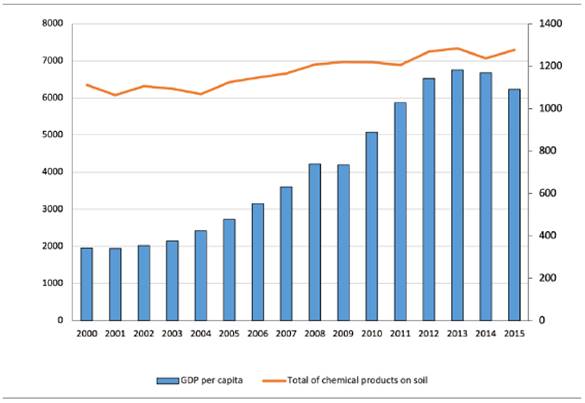
It is important to analyze these two new indicators against other measures related to economic activity. The next figure shows the evolution of GDP per capita and the total use of chemical fertilizers and pesticides. Their growth rate was 8% and 1%, respectively, and the first had more variance than the other.
4. Estimations
Finally, in this section, I present several estimations to recognize these new indicator relations. The following figure collects 6 equations where the total amount of chemical products on the soil, i.e. chemical fertilizers and chemical pesticides, are dependent variables. Other indicators such GDP, square of GDP, GDP per capita and its square are independent. The estimation method was by least squares with robust standard errors to fix heteroscedasticity.
Pollution and economic activity are directly related with 99% confidence (equations 1,3,5). This result shows that the more the economy grows, the higher the amount of soil pollutants there will be. The chemical fertilizer indicator and GDP per capita were closely associated (equations 5 and 3). Use of chemical fertilizers grows 0.038 per every percentual point of GDP per capita.
Equations 2 and 4 were estimated to verify an inverted-U relation. Even if the estimators are significant, their value does not provide relevant information that reassures the inverted-U form.
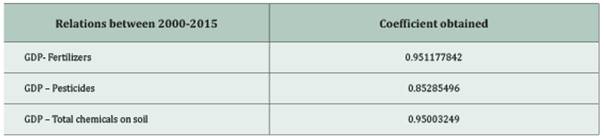
This linear correlation coefficient allowed us to know how data relate over time. The values vary between 1 and -1, values near 1 mean that the relation is positive and values near -1 mean that the relation is negative. Results show that the relation between GDP and total use of fertilizers is strongly positive; the same occurs with the total amount of chemicals on soil. The relation between pesticides and GDP is less strong, but it is positive.
Table 4 Estimations between soil pollution and GDP
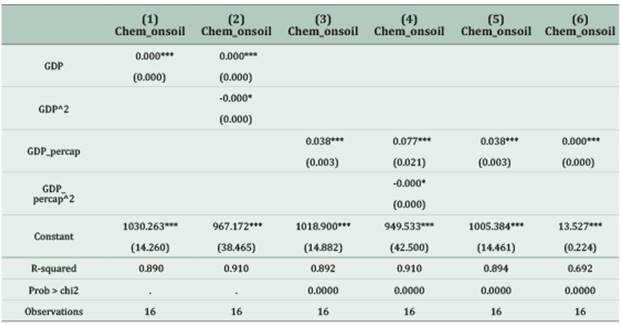
Notes: * p<0.10, ** p<0.05, *** p<0.01, standard errors in parentheses. Source: Prepared by the author based on Minagri (2018), World Bank data (2021)
5. Final conclusions
It is important to point out the impacts of chemical products on the soil. On the one hand, fertilizers generate impacts like infertility, acidity, increasing microorganisms and groundwater pollution.
On the other hand, pesticides are the most harmful chemical product. They are available in different presentations depending on the pests to be eliminated. There are insecticides, acaricides, rodenticides, fungicides, bactericides, nematicides, herbicides and molluscicides that even control the population of mollusks (FAO, n.d.). All of these also have negative effects on ecosystems. Environmental contamination by these chemicals is highly toxic. If handled poorly, harvested products could even have residual toxins. In addition, they raise the costs of phytosanitary control (Cisneros, n.d.).
Regarding their persistence, pesticides have a half-life of decades; pesticides with moderate persistence have a half-life of 6-12 months; and pesticides with low persistence have a half-life of 6 months (CARE, 2006). Toxic components break down slowly and accumulate in groundwater, soil, and animal and human tissues. Pesticides with low persistence can pollute surface and groundwater. Therefore, flows that directly move to larger bodies of water can cause the death of fish, as it is the case of soybean planting in Argentina (Contrapoder, 2018).
Nevertheless, it is important to recognize that the use of agrochemicals can be moderate by the minimum law of Von Liebeg, which, states that that the local yield of terrestrial plants should be limited by the nutrient that is present in the environment in the least quantity relative to its demands for plant growth (Morris & Blackwood, 2007). This represent a method that cares about soil pollution and should be applied even in industrial agriculture.
Recognizing these two strands, the systemic strand and the holistic strand, drives accountability for food production and consumption. From the government perspective, the promotion of holistic agriculture is the key to ensure food security and reduce land degradation in the mid- and long term. Changing production methods of the private sector is the most difficult, but the government must reorient them through updated policies that consider environmental pressures. From the point of view of consumers, we must demand - collectively or individually- food security taking into account the excess of population growth in the next few years as hunger increases in different ratios in several countries. As a society, we need to reformulate our ways to conceive and engage with nature. This study shows soil pressures, but with climate change, all family farming and rainfed agriculture will be affected and, thus, food security. In Peru, 70% food production is generated by family farming.
How to Cite: Minaya Florez, G. (2022). Soil pressures: an economic and ecological overview of the agricultural sector in Peru (2000-2015). Revista Kawsaypacha: Sociedad Y Medio Ambiente, (10), A-006. https://doi.org/10.18800/kawsaypacha.202202.006