Inglés (pdf)
 Articulo en XML
 Referencias del artículo
 Enviar articulo por email
 Citado por SciELO
  Similares en
SciELO
Similares en
SciELO  uBio
uBio 
 Permalink
Introduction
Industrial enzyme production has a wide application in biotechnology, because of the high market value of this proteins and the potential use of renewable and low-cost raw materials, such as cellulose and lignocellulose (Kirk et al. 2002, Kuhad et al. 2011, Guerriero et al. 2015). Lignocellulose is the major component of plant biomass, comprising around half of the matter produced by photosynthesis and representing the most abundant renewable organic resource in soil (Sánchez 2009). However, obtaining sugars from lignocellulosic biomass for fermentation is still an expensive process, mostly due to low enzyme yields of producing microorganisms (Galbe & Zacchi 2002) and chemical complexity and variability of this substrate (Karimi & Taherzadeh 2016). Thus, optimal use of lignocellulose depends on the selection of microorganisms that exhibit a high lignocellulase enzymatic yield, as well as culture systems that guarantee and promote this production.
Previous studies have demonstrated that growth in a mixed biofilm system formed by filamentous fungi Aspergillus niger and Trichoderma reesei, leads to a total cellulase yield increase of 50-70% with respect to single biofilm cultures (Villena 2002, Gutiérrez-Correa & Villena 2012). Although mixed cultures constitute a promising fermentation system, it has not been yet addressed how much of this enzymatic synergy depends on a certain proportion of fungal mixed biomass and what are the effects of growth rate and culture time on this proportion. In order to assess the influence of fungi proportion on the mixed biofilm system productivity, it is essential to develop a method to accurately determine biomass of each species in mixed cultures.
When direct quantification of biomass is not possible (e. g., sample scarcity, irreversible biomass-substrate binding), an indirect approach might be a more feasible manner to collect biomass data. Several methods for indirect biomass quantification have been developed, namely, microscopic techniques such as spore counting or hyphal thickness and length measurement (Schnürer 1993, Balser et al. 2005); cell membrane and wall components quantification like ergosterol (Gessner et al. 1991, Nylund & Wallander 1992, Lau et al. 2006), phospholipid fatty acids (Olsson et al. 1995) and glucosamine (Matcham et al. 1985); and additionally inner-cell components such as total protein (Abd-Aziz et al. 2008) and DNA (Zhao et al. 2013, Liu et al. 2017). Methods based on DNA quantification receive increasing attention for their ability not only to estimate microbial biomass content but also to provide species composition data (Baldrian et al. 2013). In this sense, the aim of this work was to develop a method that allows an accurate quantification of A. niger ATCC 10864 and T. reesei QM6a biomass in a mixed biofilm system by means of the specific quantification of the genomic DNA (gDNA) of each fungus by quantitative PCR (qPCR).
Material and Methods
Fungal growth conditions.- Aspergillus niger ATCC 10864 and Trichoderma reesei QM6a were kindly donated by the Agricultural Research Service (ARS) Collection of the United States Department of Agriculture (USDA). The strains were maintained on potato-dextrose agar (PDA) slants at 28 °C in the dark until complete spore germination (∼5 days). Spores were collected with 0.1% Tween 80 solution, counted with a hemocytometer and diluted in sterile distilled water.
Mixed biofilm formation.- Spore suspensions (1 x 10⁶ spores/mL) were used as inoculum for biofilm formation in a proportion of 1.5% (v/v) for each fungus (Villena 2002). Briefly, 250 mL flasks containing a polyester fiber square (9.61 cm2) in 70 mL of sterile distilled water were inoculated with 1.05 mL of T. reesei spore suspension and incubated at 28 °C and 175 rpm for 2 h in order to allow spore adhesion. After this contact period, cloths were washed three times with sterile distilled water for 15 min at 175 rpm in order to remove non-adhered spores and transferred to new 250 mL flasks containing 70 mL of sterile distilled water. Then, flasks were inoculated with 1.05 mL of A. niger spore suspension and incubated for 30 min under the same conditions than T. reesei spores. Finally, co-inoculated cloths were washed as described previously and transferred to new flasks containing 70 mL of the culture medium for biofilm formation at 28 °C and 120 rpm for 120 h (Villena & Gutiérrez-Correa 2006). At each time point, mixed biofilms were recovered by filtration, washed with sterile distilled water and dried under vacuum at 45 °C for 2 h using a Concentrator Plus (Eppendorf, DE). Dry biofilms were kept at -80 °C until gDNA extraction.
gDNA extraction.- Freeze-dried biofilms were ground in liquid nitrogen using a mortar and pestle. Subsequently, 10 mg of pulverized biomass was used for gDNA extraction according to Cenis (1992) with some modifications. Briefly, biomass was disrupted in microtubes containing 500 μL of lysis buffer and 200 mg of 0.5 mm glass beads by vigorously vortexing for 10 min. Disrupted biomass was digested with 5 μg of RNAse A for 10 min at 37 °C. For protein and debris precipitation, 250 μL of 3M sodium acetate was added. gDNA was precipitated with room temperature ethanol and, after washing, pellets were resuspended in ultrapure water. gDNA integrity was confirmed by agarose gel electrophoresis and purity ratios were calculated spectrophotometrically using a Nanodrop® (Thermo Fisher Scientific, US). The amount of extracted gDNA was determined by fluorometry using the Qubit Quant-iT® dsDNA High-Sensitivity Assay Kit (Thermo Fisher Scientific, US) following the manufacturer’s instructions. For each biofilm, triplicate extractions were performed.
Diphenylamine Assay.- Biomass-gDNA correlation was tested by the diphenylamine colorimetric method according to Zhao et al. (2013).
Primer design.- Sequences of actin and β-tubulin genes of each fungal species were downloaded from the National Center for Biotechnology Information (NCBI) database. Afterwards, Clustal Omega multiple sequence alignment software was used to identify non-conserved regions between genes of both fungi. From these regions, specific primers for qPCR were designed using the PrimerQuest and OligoAnalyzer online tools (Integrated DNA Technologies, US). Primer sequences are shown in Table 1.
Specificity tests were performed in silico with Primer-BLAST and FastPCR 6.0 programs using the sequences of both genes as template. Additionally, to experimentally confirm primer specificity, a qPCR assay was performed using 500 pg of mixed gDNA, A. niger gDNA or T. reesei gDNA as template.
Table 1: Primer sequences used in this work.
| Primer code | Sequence (5’-3’) | |
|---|---|---|
| An_act1 | F: TGGGTTCTTCCCACTCTTCATA | R: GTGCTAACATGACGGGTAATTC |
| Tr_act1 | F: ATCCCAATAGCTGACACCAG | R: TATAGCTATGGCGTGGTAAGGG |
| An_tubB2 | F: GGTCTTGATTGGTGTTTGGTG | R: CTAAGAGACGATGTTCCATCCC |
| Tr_tubB1 | F: CTGCAACTCTGGTGGCTTG | R: TCACGAGTCAGCTTGTAATCTC |
qPCR conditions.- qPCR was carried out in 96-well plates using 10 μL reaction containing 1x commercial Kapa SYBR® Fast qPCR Master Mix (2x) Universal kit, 0.2 μM of each primer and 1 μL of DNA extract (500 pg). Amplifications were performed using a CFX96TM Real-Time System thermocycler (Bio Rad, US) with standard PCR conditions of 95 °C for 3 min for initial denaturation followed by 40 cycles of 3 s at 95 °C and 20 s of alignment/extension/data collection at 60 °C. Finally, a gradient step from 65 to 95 °C with 0.5 °C increases for melting curve plotting was included. The purity of the PCR product was checked by the presence of a single melting peak. Each sample were analyzed in triplicate and the experiment was performed with both the actin and β-tubulin primers.
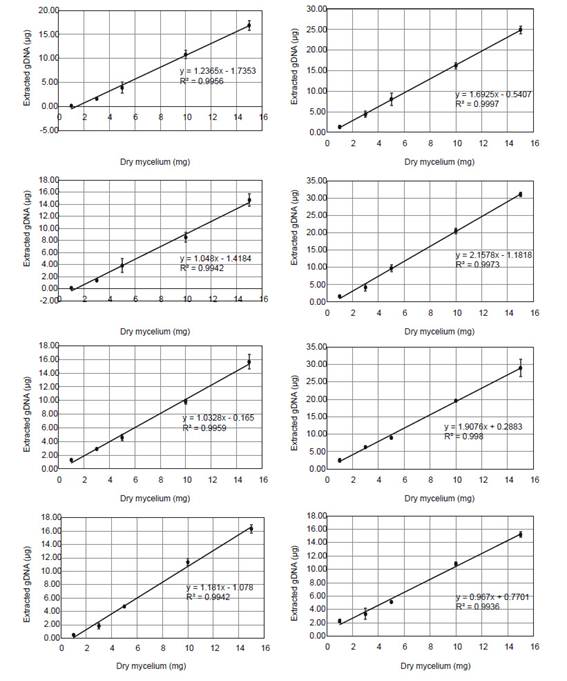
Standard curves.- For absolute quantification of T. reesei and A. niger gDNA in mixed biofilms, qPCR two-fold serial dilution standard curves were generated for each pair of primers (An_act1, An_tubB2, Tr_act1, Tr_tubB1) using a known proportion of mixed gDNA according to Table 2. The linear-regression equations obtained in each case (Ct versus Log DNA) allowed the calculation of the initial amount of DNA in the sample. To transform the DNA data into biomass (mg), extraction yield curves were generated using 1, 3, 5, 10 and 15 mg of mycelium from individual biofilms of A. niger and T. reesei at each time (Fig. S1).
Results and Discussion
In order to analyze mycelial proportion evolution on the biofilm over time, mixed biomass was collected from 48 to 120 h. In this regard, standard curves for qPCR quantification were generated using specific primers (Fig. 1). Mixed gDNA-based curves were used because it allows to recreate or simulate the reaction conditions of mixed gDNA samples (Daly et al. 2017), such as variable A. niger/T.reesei proportions (Table 2). Non-specific amplification (mispriming) and amplification between primers (primer-dimers) has been previously reported as a consequence of low copy number of target sequence and high primer concentration at the beginning of PCR reaction (Chou et al. 1992, Brownie et al. 1997). In fact, two melting peaks have been observed only when A. niger or T. reesei gDNA proportion was set below 0.39% (data not shown), indicating that non-specific gDNA interferes with specific primers’ amplification and this interference depends on target copy number.
Table 2: A. niger and T. reesei gDNA proportions in qPCR standard curves.
| A. niger/T. reesei gDNA (pg/pg) | A. niger/T. reesei gDNA proportion (%) |
|---|---|
| 640/40 | 94.12/5.88 |
| 320/80 | 80/20 |
| 160/160 | 50/50 |
| 80/320 | 20/80 |
| 40/640 | 5.88/94.12 |
Biomass data (mg) of mixed biofilms was inferred from gDNA employing extraction yield curves made for each fungal species and each time point. Relationship between gDNA and biomass was confirmed to be linear in all extraction yield curves with Pearson’s coefficient of determination (R2>0.99) and in the whole mixed culture by using the diphenylamine colorimetric method (R2=0.94).
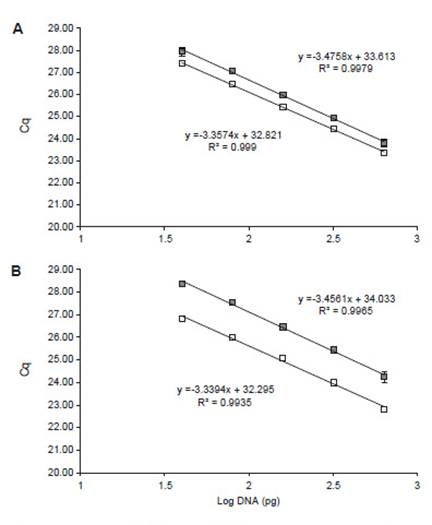
Figure 1: qPCR standard curves of (A) actin primers An_act1 (empty squares) and Tr_act1 (filled squares) with efficiencies of 98.54% and 95.23%, respectively; and (B) β-tubulin primers An_tubB2 (empty squares) and Tr_tubB1 (filled squares) with efficiencies of 99.28% and 94.69%, respectively. (n = 3).
Other authors have used specific biomass quantification methods. Chatterjee et al. (2016) used a quantification method based on densitometry of specific restriction fragment patterns (RFLP-like), however, it lacks a gDNA extraction and PCR normalization. Others have reported biomass content in mixed cultures in terms of gDNA proportion measured by qPCR (Arfi et al. 2013, Benoit- Gelber et al. 2017). Nevertheless, since proportions of extracted gDNA from a mixed sample do not correspond necessarily to proportions of mixed biomass, results might be biased. On the other hand, there are other authors that have established methods for quantifying specific biomass based on DNA data correction with extraction yield values (Jonkers et al. 2012, Song et al. 2014), and even correction for substrate interference on these yields (Daly et al. 2017). Here, we present a corrected method that accounts not only for inherent differences between species-specific gDNA extraction yields, but also for natural changes in mycelial composition through time, such as melanin deposition and cell wall hardening (Karakousis et al. 2006), or secretion of stress-related pigments as a result of mixed culture.
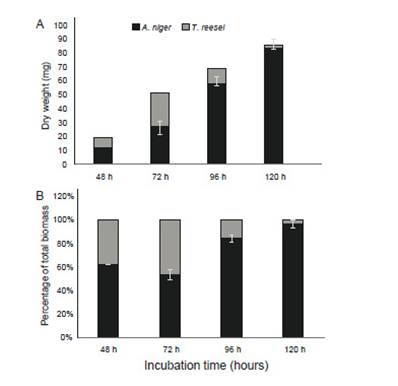
Figure 2: Mycelial abundance of A. niger and T. reesei mycelia in terms of inferred dry weight (A) and biomass percentage using actin-specific primers (B) (n = 3).
Results of specific quantification of biomass in the mixed culture composed of A. niger and T. reesei are shown in Figure 2 in terms of biomass percentage. Quantification using β-tubulin primers was almost identical to actin primers (data not shown). We detect that mycelium proportion in biofilms changed over time: at 48 h, 62% of A. niger and 38% of T. reesei; at 72 h, 53.5% and 46.5%; at 96 h, 84.5% and 15.5% and at 120 h, 95.9% and 4.1%, respectively. In this mixed culture, it is remarkable the initial and faster T. reesei growth, in comparison to A. niger from 48 to 72 h (Figure 2A). However, in spite of its growth limitation, A. niger could overcome T. reesei, showing a highly competitive fitness that has been previously reported for this fungus (Chatterjee et al. 2016, Kolasa et al. 2014). Such behavior might be explained, rather than by growth rates, by the potential capacity of each competitor to establish antagonistic (e. g., secondary antifungal metabolites, cell wall-degrading enzymes) and defensive strategies (e. g., detoxification systems, drug resistance transporters) for displacing its “rival”, as mentioned earlier (Hiscox et al. 2018). Undoubtedly, enzymatic production in mixed cultures is dependent on this behavior, and future studies for improving lignocellulase yields should use this quantification method to assess properly individual contribution of mixed-cultured fungi to enzymatic secretion.
Conclusions
A specific method to indirectly quantify biomass in mixed cultures was developed. qPCR reaction conditions and species-related biomass differences that interfere with gDNA yields have been corrected by using mixed gDNA qPCR standard curves and extraction yield curves for each fungus and each time point. Relative abundance results show that the presented method for specific biomass quantification offers valuable information about mixed culture composition and biological interactions linked to lignocellulase production.