


 Inglês (pdf)
 Artigo em XML
 Referências do artigo
 Enviar este artigo por email
 Citado por SciELO
  Similares em
SciELO
Similares em
SciELO 
 Permalink
1. INTRODUCTION
Throughout history, seismic motions recorded worldwide have evidenced catastrophes of high magnitudes generating considerable damage and even the collapse of structures. This is a latent problem in Peru as it is part of the Pacific Ring of Fire, making it one of the countries with the highest seismicity in the world. In addition, the disorderly growth of buildings in Ayacucho city generates risky conditions that can bring large economic and human losses.
Nowadays, many researchers (1,2,3) are implementing modern procedures to assess risk in bridges, buildings, dams, as they are subject to multiple hazards such as earthquakes, hurricanes, debris flow, landslides. Likewise, new technological tools are being used to assess seismic vulnerability. For example, 4 implements the use of drones and the photogrammetry technique within a vulnerability study. In addition, Peru has been developing seismic microzoning studies in different cities (5,6,7). These investigations show the importance and necessity of conducting risk studies, which serve as principal motivation for the present research.
The main objective of this article is to evaluate the seismic risk of buildings in Ayacucho - Peru. This due to the fact that this city is exposed to a latent seismic threat and where informality has become common in the study area with the presence of quite old buildings and with materials that can become extremely vulnerable to a seismic event. Therefore, this research aims to develop seismic zoning, vulnerability and risk maps, which serve both the population and the government in order to anticipate and mitigate possible disasters.
2. BACKGROUND
Many researchers devoted great effort to assess seismic risk of buildings. For instance, Mena8; evaluated the seismic risk in the urban area of Barcelona city, Spain, where despite not being an area of great seismicity, high damage was obtained for relatively low intensity levels due to the high vulnerability of its buildings.
Angeletti et al.9 studied the damage in structures caused by an earthquake in Italy, which made it possible to generate vulnerability functions by relating the damage index with the vulnerability index conditioned to the maximum soil acceleration. Due to the importance of these, many functions began to be generated and simulated for different countries, for example, Barbat et al.10 in Spain; Maldonado et al.11 in Colombia; Quispe12 in Peru.
In Peru, several researchers (13,14,15) evaluated the seismic hazard over the years considering various seismogenic sources which were updated over time. The results of these research were captured in isoacceleration maps considering different levels. A free consultation Web application was developed taking into account a data density for a 0.10° longitude-latitude grid15.
In the same way, (16,17,18) evaluated the seismic risk of a group of buildings in several places in Peru, taking into account the vulnerability index methodology and the probabilistic evaluation of seismic hazard. Furthermore, they carried out geophysical studies to know the dynamic behavior of the soil. In this way, the performance and robustness of the methodology have been shown in many study areas. For example, 19 adapts the vulnerability index method for seismic risk studies in the city of Mérida, Venezuela.
3. METHODOLOGY
A total of 2078 buildings located in Ayacucho city have been evaluated (the southern central part of Peru). The study sample includes adobe buildings, confined masonry and reinforced concrete, where the results of seismic vulnerability were analyzed taking into account each structural typology.
Given the large number of buildings that the study population represents, the seismic vulnerability of the most representative buildings of each block was analyzed, allowing representative maps to be generated. Likewise, in the case of seismic hazard, the maximum acceleration of the ground has been evaluated for four seismic scenarios, placing greater emphasis on the rare earthquake as this is the design earthquake according to the E.030 Seismic Design Standard (RNE of Peru). Additionally, as part of the seismic hazard study, a geophysical test called MASW were carried out throughout the study area, which together with information collected from various soil studies, allowed the generation of a seismic geotechnical zoning map of the Ayacucho city. The seismic hazard and vulnerability results in buildings allowed to know the level of damage, being represented by risk maps for different seismic scenarios.
4. STUDY AREA
Ayacucho is one of the most important cities in Peru, located on the eastern slope of the Andes Mountain range at an altitude of 2,760 meters above sea level (13°09´37´´S and 74°13´33´´W, UTM coordinates 583899.8 m E and 8545010.6 m N, DATUM WGS84, zone 18, southern hemisphere). The study area is Ayacucho city, includes both the urban and peripheral areas of urban expansion of the Ayacucho district. This district comprises a large territorial extension, considered as the capital of the sixteen districts that make up the province of Huamanga in the department of Ayacucho. Given the great extension of its territory, the study area does not include rural areas because small populated centers are scattered at far distances throughout the district (see Fig. 1).
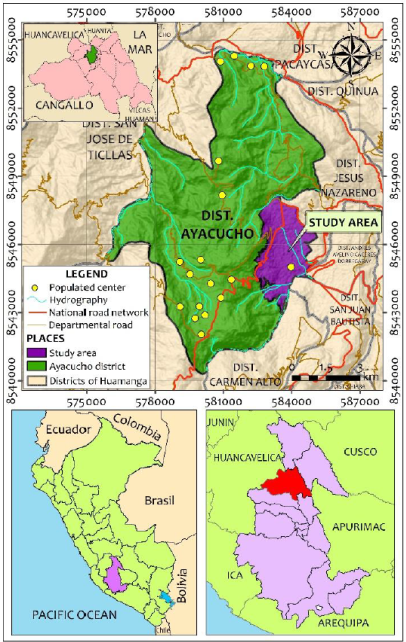
The study area comprises a total of 7,697 km2 with the following limits: the east it borders the district of Andrés Avelino Cáceres Dorregaray, Jesús Nazareno and San Juan Bautista; to the west, with the Huascahura Populated Center; to the North, with the Peasant Community of Mollepata; and to the south, with the district of Carmen Alto. According to the INEI, in the last census of 2017, the district of Ayacucho has a total population of 99,427 inhabitants, of which 97,200 live in the urban area (97.8% of the inhabitants of the district live in the study area of this research). Similarly, in 1993 the district of Ayacucho has registered a total of 18,327 private homes, for the year 2017 a total of 29,860 homes have been registered; therefore, there is an average of 2.1% annual growth rate of housing for period 1993-2017, which is reflected in the disorderly growth of housing in the city.
5. SEISMIC HAZARD
The use of the R-CRISIS (v20.1.0) computer program allowed the evaluation of the seismic hazard in Ayacucho city with a grid increment of 0.0025° in latitude and longitude (specifically spaced every 277 m), allowing to obtain a fairly dense data of the results. To achieve this, it was necessary to have a file with the extension shp. containing the location of Ayacucho city. Similarly, it is important to have a file extension asc. that contains the neighborhoods, associations or any other location within the study area, in which it is desired to know precisely the level of maximum acceleration of the ground. According to Kramer20, a probabilistic seismic hazard analysis can be described as a four-step procedure: Identification and characterization of the seismogenic sources, characterization of the seismicity or temporal distribution of the seismic recurrence of each of the sources, application of the laws of attenuation to each seismogenic source, and finally the calculation of the probability of exceedance; All these steps considered in this research are described in the following sections.
5.1. SEISMICITY
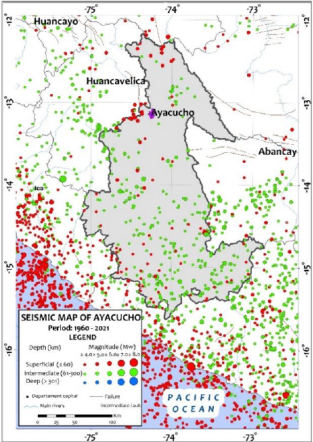
The seismic activity in Peru has its origin in the friction generated by the subduction process of the Nazca plate under the South American plate and in the internal deformation of both plates (intraplate earthquakes), the latter being the ones with the greatest incidence or danger about the Ayacucho city. Silgado21, made an important ordered description of the seismic history of Peru for the period between 1513 to 1974. From it, it has been shown that many of the earthquakes that occurred in Peru were generated outside the Ayacucho city, but due to its destructive nature with magnitudes of up to 8.4 Ms, its waves came to shake the city of Ayacucho, reaching an intensity of IV to V MM. Peru is one of the countries that has little information on the earthquakes that occurred between the 16th century and the 19th century, where the records that are available are usually not representative, since important earthquakes may have occurred in remote regions that were not recorded. It is from 1980 onwards that more information began to be obtained on a large number of seismic records that occurred in Ayacucho, reaching intensities of up to VII on the MSK scale. The areas of the districts of San José de Ticllas, San Pedro de Cachi, Vinchos and Santo Tomas de Pata (very close to the district of Ayacucho) have suffered continuous and high seismic activity, due to the presence of faults and folding of several kilometers in length that have an alignment SE - NW.
A total of twenty-nine seismogenic sources have been used in the present research. Twenty of these were subduction, in which interface mechanisms have been differentiated (F1, F2, F3, F4, F5 and F6), superficial intraplate (F7, F8, F9, F10, F11, F12, F13, F14, F15 and F16) and intermediate (F17, F18, F19 and F20). Similarly, nine continental seismic sources have been used (F21, F22, F23, F24, F25, F26, F27, F28 and F29). Both geometries of these sources are consistent with the subduction model proposed by22.
The geometry of each of these sources (Fig.3) was entered into the program, always keeping the Source is living option selected. Besides, the Software contemplates various types of seismic sources through the Source Type option and for the present study the area type sources were used. Together with the geometry of the source, the size of the rupture area that generates the seismic movement can be defined through the parameters K1 and K2; in the present research, for the definition of these parameters, the model of Singh et al.23 in all seismogenic sources. In the same way, a single integral part of the source is considered with a thickness equal to zero since they are working with area-type sources.
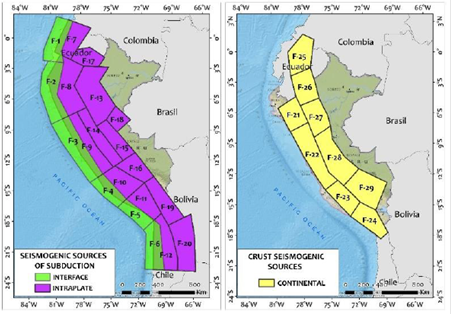
Fig. 3 Map of the seismic sources used. (a) Seismic sources of subduction (Interface and intraplate). (b) Continental seismic sources.
The seismic recurrence analysis was performed considering the Gutenberg and Richter model24. TABLE I shows seismological recurrence parameters of the twenty-nine seismogenic sources used. Each of these seismological parameters were integrated into R-CRISIS software, additionally, the coefficient of variation β was introduced due to the uncertainty that this parameter may have. In the same way, no standard deviation or uncertainty range of the maximum magnitude is considered (Mmax).
TABLE I Seismological parameters of seismogenic sources15.
| Source | seismological parameters | |||
|---|---|---|---|---|
| Mmin | Mmax | β | Rate | |
| F1 | 4.3 | 8.1 | 1.286 | 3.1 |
| F2 | 4.5 | 8.0 | 1.302 | 4.2 |
| F3 | 4.8 | 8.6 | 1.732 | 3.98 |
| F4 | 4.4 | 8.4 | 1.73 | 6.62 |
| F5 | 4.8 | 8.4 | 1.473 | 2.58 |
| F6 | 4.5 | 8.4 | 1.344 | 3.53 |
| F7 | 4.1 | 7.9 | 0.991 | 1.3 |
| F8 | 4.4 | 6.6 | 1.99 | 3.38 |
| F9 | 4.5 | 7.3 | 2.04 | 6.47 |
| F10 | 4.5 | 7.0 | 1.805 | 6.57 |
| F11 | 4.8 | 7.8 | 2.251 | 4.85 |
| F12 | 4.8 | 7.6 | 2.58 | 19 |
| F13 | 4.3 | 7.4 | 1.491 | 3.71 |
| F14 | 4.2 | 6.6 | 1.28 | 2.07 |
| F15 | 4.6 | 6.0 | 2.334 | 2.52 |
| F16 | 4.1 | 6.9 | 1.307 | 1.25 |
| F17 | 4.4 | 7.3 | 1.697 | 3.87 |
| F18 | 4.8 | 7.1 | 2.413 | 3.13 |
| F19 | 4.8 | 7.0 | 2.307 | 2.92 |
| F20 | 4.5 | 7.7 | 2.352 | 11.7 |
| F21 | 4.0 | 7.1 | 0.58 | 0.461 |
| F22 | 4.1 | 7.2 | 1.068 | 1.32 |
| F23 | 4.5 | 7.0 | 1.384 | 0.675 |
| F24 | 4.4 | 7.4 | 1.314 | 1.28 |
| F25 | 4.2 | 7.0 | 1.133 | 2.04 |
| F26 | 4.6 | 6.7 | 1.384 | 0.889 |
| F27 | 4.8 | 6.8 | 2.162 | 1.27 |
| F28 | 4.5 | 7.0 | 1.667 | 2.85 |
| F29 | 4.3 | 7.0 | 1.259 | 1.42 |
In order to determine the seismic response of the ground in a given place produced by a seismic event in a specific source, the attenuation laws are used. In Peru, several attenuation laws have been used, prepared with seismic records from Peru and other countries; a large number of these were analyzed by25 who concluded that, among all the attenuation laws analyzed, they are those of Youngs et al.26 and Sadigh et al.27 which yielded average results of acceleration values and that these are consistent with tectonics and seismotectonics in Peru. Therefore, in order to determine the seismic response in Ayacucho city, the attenuation laws of Youngs et al. for subduction earthquakes and those of Sadigh et al. for continental earthquakes are used.
5.2 SEISMIC MICROZONATION
The study area at the regional level corresponds to the geomorphological unit called Penillanura Disectada. On the other hand, at the local level, the geomorphology of the Ayacucho city is made up of units of ravines and slopes which have given rise to a cover of alluvial deposits that are overlying the sedimentary deposits of the Ayacucho formation. The local geology of Ayacucho city is composed of rocks of sedimentary and volcanic origin whose ages range between the upper Tertiary and the recent Quaternary. Specifically, in study area, the sedimentary deposits of the Ayacucho formation and the alluvial deposits are found in a greater proportion, and in a lesser proportion there are volcanic deposits of the Molinoyocc formation that overlie deposits of the Ayacucho formation.
In order to characterize the soil in Ayacucho city, a large database of soil studies prepared by28 and29 was taken into account. It was possible to collect information on classification, exploration and sampling of soils and rocks, as well as values of soil bearing capacities and some seismic refraction tests. In order to achieve a seismic geotechnical zoning in Ayacucho city, geophysical tests MASW (Multichannel Analysis of Surface Waves) were carried out and allowed to soil characterize from shear wave velocities. Fig. 4 depicts a map of the distribution of seismic refraction probing, as part of the information collected, as well as the MASW probing of the present study.
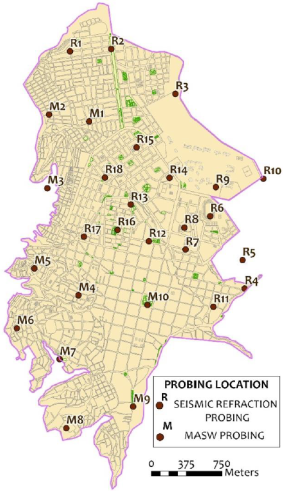
The MASW method or Multichannel Analysis of Surface Waves allows to determine the stratigraphy of the subsoil under a point indirectly, based on the change in the dynamic properties of the materials that make it up” [30, p. 35]. Each of these tests were carried out at various points in study area, distributed in such a way that the results could be interpolated in order to generate seismic zoning maps. In addition, to achieve this end, the optimal field parameters of a MASW survey established by31 were taken into account.
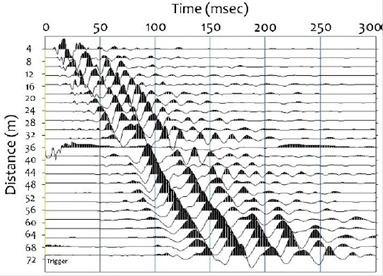
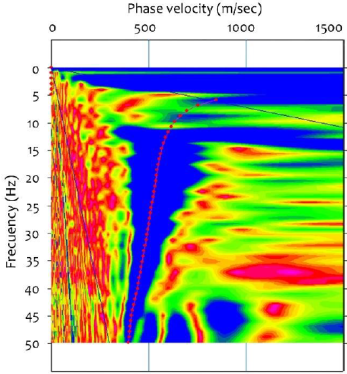
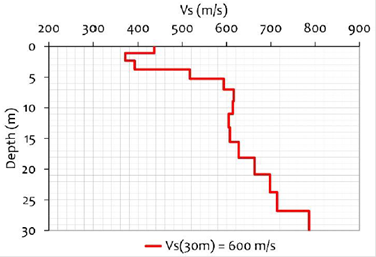
Once the field work was completed, data processing continued. This process consisted of obtaining dispersion curves (a curve that relates phase velocity versus frequency) (Fig. 6) from the seismic wave record obtained in each field scan line (Fig. 5). Then, through an iterative process (inversion method), shear wave velocity profiles (Vs) were obtained using the different modules of the SeisImager/SW program (Fig. 7).
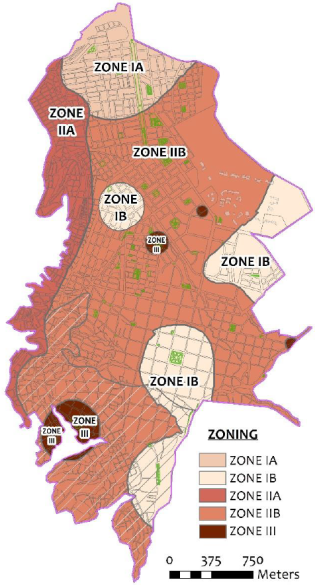
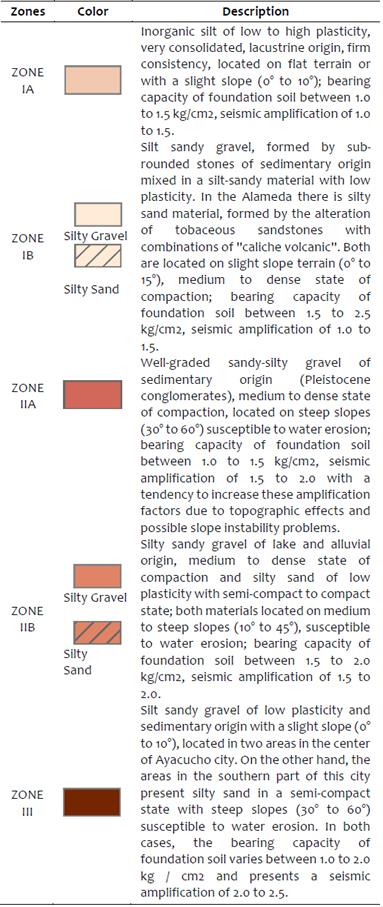
The soil, geological, geotechnical and geophysical studies have made possible to describe the mechanical soil characteristics and its seismic response. With these results, a seismic geotechnical zoning map of Ayacucho city is obtained, as can be shown in Fig. 8. This map presents 3 zones, where the first two are subdivided into A and B. Zone IA differs from zone IB by the type of material and by bearing soil capacity. Zone IIA differs from zone IIB due to the bearing soil capacity and the land slope, where zone IIA presents lower soil resistance and greater slopes. A better description of each zone is shown in TABLE II. This table shows values such as the bearing capacity of the soil obtained from the Meyerhof formula, for which the geomechanical properties of the geological units and direct shear tests were taken into account as part of the information collected. On the other hand, the seismic amplification of the soil obtained from the one-dimensional propagation theory of shear waves in soil deposits is also described, using three recorded input earthquakes as excitation force through the SHAKE program.
5.3 EVALUATION OF THE SEISMIC HAZARD
The seismic hazard curves are determined under the probability theorem: the probability that the intensity I is greater than or equal to a specific value i, is calculated for a possible earthquake at a possible location within the source and then multiplied by the probability that specific magnitude can occur at that location. Then, the process is repeated for all possible magnitudes and locations, to finally add all of them. The calculation of the seismic hazard for a specific place of interest is influenced by the magnitude (m) and the distance (r), being defined by equation (1).

Where P[I≥i/(m,r)] is the probability that the intensity I exceeds a specific value i for a possible earthquake located within the source, and it is obtained through the attenuation relationship. Also, fM(m) and fR(r) are the probability density functions for magnitude and distance.
Equation (1) summarizes the theory developed by Cornell32 to analyze seismic hazard. The evaluation of this integral is given by the R-CRISIS software, which was developed by Ordaz et al.33 in calculating the seismic hazard.
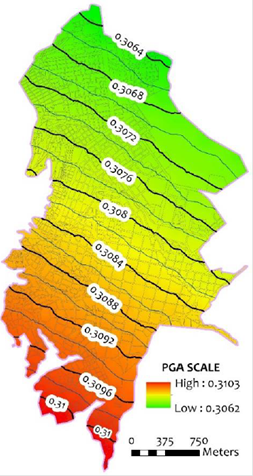
As part of the results of the probabilistic evaluation of seismic hazard, the R-CRISIS program allowed knowing the maximum acceleration of the ground at any point within the study area. For a better representation, in Fig. 9 a map of isoaccelerations of Ayacucho city is presented for a return period of 475 years (design earthquake, according to the E.030 Peruvian Norm). In addition, in TABLE III, the results of the maximum ground accelerations for the different seismic scenarios analyzed are presented.
TABLE III Peak ground acceleration (PGA) at bedrock level expected in Ayacucho city.
| Seismic scenario | Return period | PGA |
|---|---|---|
| Frequent earthquake | 43 years | 0.14g |
| Occasional earthquake | 72 years | 0.17g |
| Rare earthquake | 475 years | 0.31g |
| Very rare earthquake | 970 years | 0.37g |
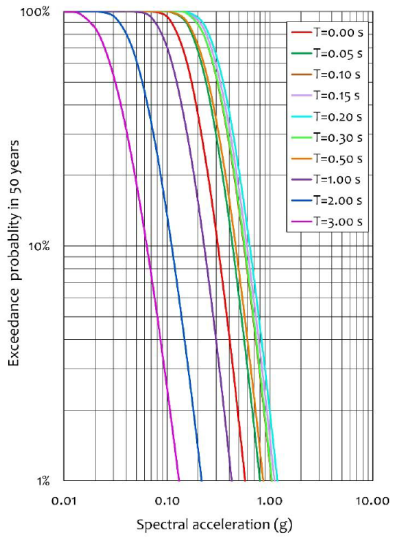
Another of the results obtained from the use of the R-CRISIS program are the seismic hazard curves, also known as hazard curves, which represent the interrelation between a range of ground motion levels and the probability of exceedance for a given period determined exposure. These seismic hazard curves will be very useful in the seismic risk assessment process when the damage level of buildings is knowing for any other seismic scenario that has not been described in TABLE III. Furthermore, the hazard curves are presented in Fig. 10 for each structural period considering an exposure period of 50 years.
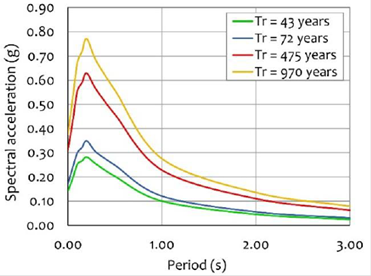
In the same way as the seismic hazard curves, the uniform hazard spectra were obtained, which help the interpretation of the seismic hazard as well as the construction of design spectra. The results of the uniform hazard spectra for each seismic scenario analyzed in this research are shown in Fig. 11. Besides, a spectrum of its own design for Ayacucho city according to Standard Code E.030 can be obtained from the uniform red hazard spectrum (Fig. 11), whose spectral values have the same probability of exceedance (10%) in all structural periods for an exposure period of 50 years.
6. SEISMIC VULNERABILITY
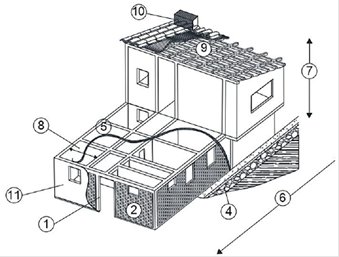
The vulnerability index methodology was used to estimate the buildings seismic vulnerability34, which consists in analysis a total of eleven parameters (Fig. 12) that characterize the susceptibility of a structure to suffer some type of damage after the occurrence of an earthquake. These parameters are:
The vulnerability index method was developed for two large groups of structures: Masonry and reinforced concrete, where the greatest number of studies and application of this methodology were in masonry structures, due to the large number of these in various countries. However, in the case of reinforced concrete structures, software and numerical methods are generally used that require greater computational cost.
6.1 VULNERABILITY INDEX
The vulnerability index for confined and adobe masonry structures is calculated as the weighted sum of the numerical values of the factor Ki by the weight factor Wi, of each of the parameters that are considered to characterize the seismic behavior of the structure, as shown in equation (2).
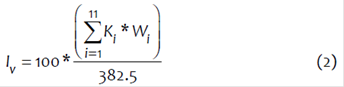
During field data collection, each parameter is assigned to the four A, B, C, D classes, depending on the condition of analyzed parameter, which ranges from A (Optimal) to D (Unfavorable). Where each of these classes corresponds to a numerical value Ki that varies between 0 and 45, this can be seen in TABLE IV. In addition, it can be seen that each parameter is affected by a weight factor Wi, which, according to [35, p. 39], reflects the importance of each of the parameters within the resistant system of the structure.
TABLE IV Values of Ki and weight (Wi) for masonry buildings.34.
| i | Parameter | Ki | Wi | |||
|---|---|---|---|---|---|---|
| A | B | C | D | |||
| 1 | Resistant system organization | 0 | 5 | 20 | 45 | 1.0 |
| 2 | Resistant system quality | 0 | 5 | 25 | 45 | 0.25 |
| 3 | Conventional resistance | 0 | 5 | 25 | 45 | 1.5 |
| 4 | Building position and foundation | 0 | 5 | 25 | 45 | 0.75 |
| 5 | Horizontal diaphragms | 0 | 5 | 15 | 45 | 1.0 |
| 6 | Plant configuration | 0 | 5 | 25 | 45 | 0.5 |
| 7 | Elevation configuration | 0 | 5 | 25 | 45 | 1.0 |
| 8 | Maximum distance between walls | 0 | 5 | 25 | 45 | 0.25 |
| 9 | Cover type | 0 | 15 | 25 | 45 | 1.0 |
| 10 | Non-structural elements | 0 | 0 | 25 | 45 | 0.25 |
| 11 | Conservation state | 0 | 5 | 25 | 45 | 1.0 |
The evaluation of the vulnerability index for reinforced concrete structures is carried out in a similar way for masonry structures, but in this case only three ratings are assigned (A, B, C), where each assigned class corresponds to a numerical value Ki that varies between -1 and 3, it can be seen in TABLE V. Finally, the vulnerability index is obtained from a weighted sum of the weight factors Wi and Ki considering equation (3).
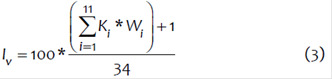
TABLE V Values of Ki and weight (Wi) for reinforced concrete buildings34.
| i | Parameter | Ki | Wi | ||
|---|---|---|---|---|---|
| A | B | C | |||
| 1 | Resistant system organization | 0 | 1 | 2 | 4.0 |
| 2 | Resistant system quality | 0 | 1 | 2 | 1.0 |
| 3 | Conventional resistance | -1 | 0 | 1 | 1.0 |
| 4 | Building position and foundation | 0 | 1 | 2 | 1.0 |
| 5 | Horizontal diaphragms | 0 | 1 | 2 | 1.0 |
| 6 | Plant configuration | 0 | 1 | 2 | 1.0 |
| 7 | Elevation configuration | 0 | 1 | 3 | 2.0 |
| 8 | connection between critical elements | 0 | 1 | 2 | 1.0 |
| 9 | Cover type | 0 | 1 | 2 | 1.0 |
| 10 | Nonstructural elements | 0 | 1 | 2 | 1.0 |
| 11 | Conservation state | 0 | 1 | 2 | 1.0 |
Finally, the level of vulnerability for both masonry and reinforced concrete is classified according to TABLE VI.
TABLE VI Vulnerability level as a function of the vulnerability index12.
| Iv range | Vulnerability level |
|---|---|
| 0% ≤ lv < 20% | Low |
| 20% ≤ lv < 40% | Medium |
| 40% ≤ lv ≤ 100% | High |
6.2 DATA COLLECTION
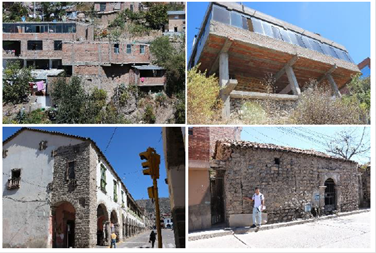
In the Ayacucho city it is common to see confined masonry buildings with poor structuring, adobe buildings in poor condition, very old colonial buildings and among many other conditions that show their precariousness, as can be seen in Fig. 13. In this sense, in order to characterize the degree of seismic vulnerability of the building, previously, the data collection of the eleven parameters that encompasses the methodology proposed by34 is carried out, after that, the vulnerability index is calculated from the use of expressions (2) and (3). To achieve this goal, it was necessary to label each block in a cadastral map with a respective number that allows data to be collected in an orderly manner.
Then, the data collection of eleven parameters is carried out using a field evaluation form that allows collecting the information to characterize the vulnerability index. This evaluation form was previously validated by the opinion of experts, who previously carried out research work related to seismic vulnerability and seismic risk. The use of this instrument requires prior knowledge for a correct assignment of classes A, B, C and D that encompasses each of eleven proposed parameters. The evaluation criteria were considered taking into account the recommendations given by36 and37 for masonry buildings, and by12 for reinforced concrete buildings.
The data of the most representative building in each block was collected taking into account the structural system and the type of material to be evaluated. For each block, three representative buildings were evaluated: one made of adobe, one of confined masonry, and one of reinforced concrete. It was carried out in order to take into account all the types of buildings present in Ayacucho city and that are better classified.
All the information collected in study area was emptied into a database taking into account each structural typology. Likewise, the vulnerability index was calculated in an automated manner and this entire database was stored in a Geographic Information System (ArcGIS) to generate the seismic vulnerability maps.
6.3 EVALUATION OF THE SEISMIC VULNERABILITY
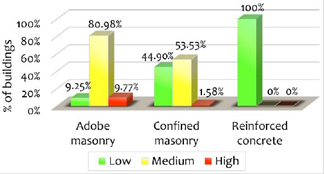
Once the vulnerability index of the buildings had been evaluated, the degree of vulnerability was classified according to structural typology (TABLE VII). These results are shown graphically in Fig. 14, where 80.98% of the adobe buildings have medium vulnerability, being the most prevalent level of vulnerability in the study area. In addition, buildings with high and low vulnerability represent 9.77% and 9.25% respectively. In the case of confined masonry buildings, there is a slight advantage of buildings with medium vulnerability (53.53%) over those with low vulnerability (44.90%) and a minimum percentage of buildings with high vulnerability (1.58%). On the other hand, 100% of the reinforced concrete buildings showed low vulnerability. The general results of TABLE VII show that of the 2078 buildings evaluated: 29.40% have a low vulnerability; 65.26%, medium vulnerability; and 5.34%, high vulnerability.
TABLE VII Results of the seismic vulnerability level in buildings evaluated.
| Vulnerability level | Adobe masonry | Confined masonry | Reinforced concrete | Total | ||||
|---|---|---|---|---|---|---|---|---|
| N° | % | N° | % | N° | % | N° | % | |
| Low | 89 | 9.25% | 484 | 44.90% | 38 | 100% | 611 | 29.40% |
| Medium | 779 | 80.98% | 577 | 53.53% | 0 | 0% | 1356 | 65.26% |
| High | 94 | 9.77% | 17 | 1.58% | 0 | 0% | 111 | 5.34% |
| Total | 962 | 100% | 1078 | 100% | 38 | 100% | 2078 | 100% |
Additionally, for a better graphical representation of the results, a seismic vulnerability map was obtained at the block level, as shown in Fig. 15. The preponderance of the average vulnerability of the buildings is represented with the color yellow. The blank spaces correspond to markets whose structural system was not analyzed, likewise the cream and light green spaces represent stadiums and parks respectively, where a level of vulnerability was not evaluated due to the fact that there are no buildings.
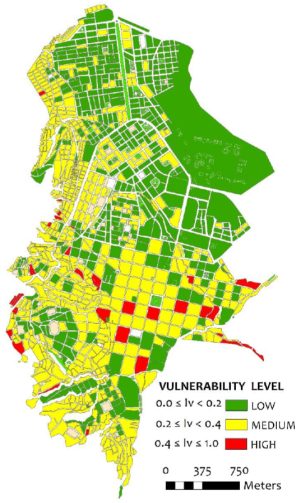
From Fig. 15, it can be seen that in the central area of Ayacucho city, located around Sucre Park, the buildings have a high and medium vulnerability level for the most part, this as a consequence of the large number of colonial buildings in poor condition and with adobe materials that have cracks due to some seismic movements produced in the city. Likewise, it can be noted that in the peripheral areas located to the west of the city, the buildings also present a high and mostly medium level of vulnerability, and this as a consequence of the disorderly growth of the city whose buildings are self-constructed on land with steep slopes without no slope stability analysis.
7 SEISMIC RISK
7.1 DAMAGE INDEX
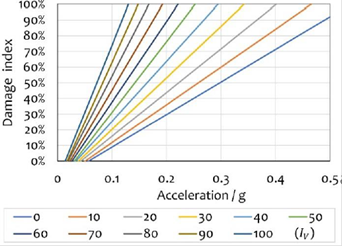
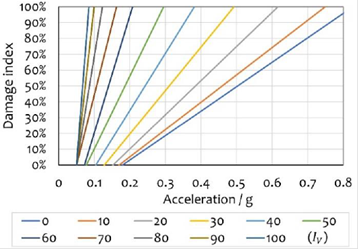
There are a variety of methodologies for assessing seismic risk. For instance, it is possible to estimate the level of damage as a function of the maximum structural distortion, where the latter is estimated using the methodology presented in38 and39, supported by40. In the present research, the damage level of buildings is estimated using the vulnerability functions, which relate the normalized vulnerability index (Iv) with the damage index (ID) conditioned by the maximum soil acceleration. The vulnerability functions proposed by Grimaz41 are used here for adobe buildings (Fig. 16); and those of Quispe12, for confined masonry and reinforced concrete buildings (Fig. 17).
Once the damage index of each building has been determined, it is necessary to characterize the level of damage to them, for this, TABLE VIII, recommended by the Earthquake Engineering Research Institute of California was used. In this case, the damage index data was obtained in the previous step as a result of vulnerability functions, besides, the structural damage level is considered as: None, Light, moderate, considerable, strong, severe or collapse.
TABLE VIII Description of scales and damage levels17.
| Damage level | Damage index (%) | Definition |
|---|---|---|
| None | 0 - 2.5 | The damage to structural elements is negligible with small cracks in non-structural elements. No repair costs are required and the effect on structural behavior is negligible. |
| Slight | 2.5 - 7.5 | The damage to non-structural elements is widespread and causes tile detachment. Possible presence of cracks in structural elements such as load-bearing walls, beams or columns, where a small percentage of the structure requires repair. The effect on structural behavior is minimal. |
| Moderate | 7.5 - 15 | The damage to non-structural elements is very important and the cost of repair increases. Damage to structural elements can be significant, affecting the structural behavior to a lesser percentage, however, the stability of the structure is not compromised. |
| Considerable | 15 - 30 | The damage to the structural elements is significant and requires extensive repairs, although it is not necessary to leave the building. The repair cost can be a significant percentage of the cost of the structure. |
| Strong | 30 - 60 | The damage to the structural elements is very important and the risk of structural stability is high. In most cases, the repair cost can be a very important percentage of the cost of the structure and it is necessary to leave the building for people safety. |
| Severe | 60 - 90 | The damage to the structural elements is very considerable and the stability of the structure is dangerous. The cost of repair is equal to or greater than the cost of the building and demolition is recommended. In addition, evacuation of the building is required. |
| Collapse | 90 - 100 | Building declared in ruins, total collapse. |
Likewise, a brief definition of structural damage and non-structural elements that each level of damage implies is made, including the repairing structural cost. This allows giving a better idea of the consequences that an eventual earthquake of a certain magnitude can bring.
7.2 EVALUATION OF SEISMIC RISK IN AYACUCHO CITY
In this section, the level of damage is evaluated for four seismic scenarios: frequent, occasional, rare and very rare earthquakes. TABLE IX shows the results of the quantity and percentage of buildings that suffer a certain damage level, depending on the intensity of earthquake. Likewise, the statistical results are presented in Fig. 18.
TABLE IX Results of damage level of buildings evaluated for each seismic scenario.
| Damage level | 0.14g | 0.17g | 0.31g | 0.37g | ||||
|---|---|---|---|---|---|---|---|---|
| N° | % | N° | % | N° | % | N° | % | |
| None | 824 | 39.7% | 433 | 20.8% | 0 | 0.0% | 0 | 0.0% |
| Slight | 218 | 10.5% | 239 | 11.5% | 0 | 0.0% | 0 | 0.0% |
| Moderate | 62 | 3.0% | 331 | 15.9% | 0 | 0.0% | 0 | 0.00% |
| Considerable | 238 | 11.4% | 107 | 5.2% | 417 | 20.1% | 1 | 0.1% |
| Strong | 734 | 35.3% | 940 | 45.2% | 623 | 30.0% | 750 | 36.1% |
| Severe | 2 | 0.1% | 27 | 1.3% | 645 | 31.0% | 383 | 18.4% |
| Collapse | 0 | 0.0% | 1 | 0.1% | 393 | 18.9% | 944 | 45.4% |
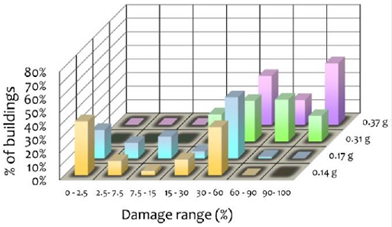
The results show that when a frequent earthquake is presented (0.14g), it is estimated that 39.7% of total buildings would not suffer any damage; 10.5% of buildings would suffer slight damage, affecting non-structural elements in a general way; 3.0% of buildings would suffer moderate damage, causing significant damage to non-structural elements and affecting structural behavior to a lesser extent. The 11.4% of buildings would suffer considerable damage, where the structural elements would suffer significant damage requiring major repairs; 35.3% of the buildings would suffer a strong damage that implies that the structural elements have very important damages, putting the stability of the structure at risk and where the cost of repair can represent a high percentage of structural cost. Finally, the 0.1% of buildings would suffer severe damage, causing the stability of the structure to be precarious due to great damage in structural elements.
Analogously to the previous considerations, for an occasional earthquake (0.17g), it is estimated that 20.8% of buildings would not suffer any damage; 11.5% would suffer light damage; 15.9%, moderate damage; 5.2%, considerable damage; 45.2%, strong damage; 1.3%, severe damage; and the rest of the buildings would collapse.
Similarly, for a rare or design earthquake (0.31g), it is estimated that 20.1% of the buildings would suffer considerable damage; 30.0%, strong damage; 31.0%, severe damage; and the rest may collapse.
For a very rare earthquake (0.37g), it is estimated that 0.1% of the buildings would suffer considerable damage; 36.1%, strong damage; 18.4%, severe damage; and the rest may collapse.
On the other hand, the highest percentage of buildings would have a strong or severe damage for a design earthquake (0.31g). This can compromise the stability of the structure. In this way, the great risk posed by most of the buildings in Ayacucho city is shown, which would be heavily damaged after an earthquake whose return period is 475 years. In addition, if it is a very rare earthquake, whose return period is 970 years, almost all the buildings would have a damage greater than the strong one, which implies that most of them would be unusable or uninhabitable.
Finally, Fig. 19 plots the seismic risk maps for different seismic scenarios analyzed. From which, it can be seen that the degree of damage is greater each time the seismic intensity (PGA) increases.
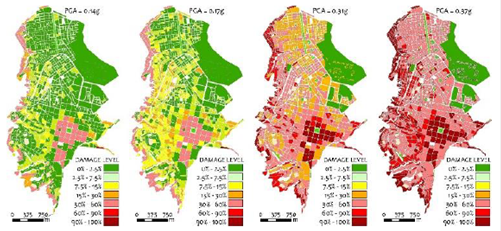
Fig. 19 Damage level measured for different peak ground accelerations (PGA) caused by each seismic scenario.
From Fig. 19, in accordance with the results of seismic vulnerability, it can be seen that the buildings located in the downtown area of the city are the ones that would suffer the greatest damage due to a seismic movement, these results are more noticeable for the scenarios seismic rare (PGA=0.31g) and very rare (PGA=0.37g) in which it is clearly distinguished that, like the central part of the city, the buildings located in the peripheral areas of urban expansion present the highest levels of damage. From the above precision it can be concluded that the buildings of Ayacucho city with a medium vulnerability level are exposed to strong and severe damage after the occurrence of a rare earthquake and even collapse for a very rare earthquake; Similarly, buildings with a high level of vulnerability are very likely to collapse after the occurrence of an earthquake whose maximum ground acceleration exceeds 0.31g.
CONCLUSIONS
The city of Ayacucho has buildings that are very vulnerable to damage in the event of a seismic event. There is a prevalence of 65.26% of buildings with medium vulnerability, followed by 29.40% of buildings with low vulnerability and only 5.34% with high vulnerability. The main parameters that conditioned these results were the configuration in plan and elevation, since it is common to observe buildings with poor structuring in the city. Likewise, the city of Ayacucho is located on steep slopes, a factor that conditioned many of the buildings to present the problem of soft floors, since in order to overcome the large slopes, the construction of column and beam porticos became common in the first levels and only in the upper levels the confined masonry.
The maximum soil acceleration in Ayacucho city for a design earthquake is 0.31g, which diverges from the value Z = 0.25 (Zone 2) established by the Peruvian Standard E.030 for Seismic Resistant Design. In addition, taking into account that the evaluated areas include urban and peripheral zones of urban expansion, the results obtained in this research show that the Ayacucho city is located between zone 2 (Z = 0.25g) and zone 3 (Z = 0.35g).
Most of the Ayacucho city is made up of silty gravel (GM) and silty sand (SM); with a small part, north of the city, made up of low to high plasticity inorganic slime. Geologically there are recent alluvial deposits overlying the sedimentary deposits of Ayacucho formation, with a state of loose compaction on slopes and compact in flat areas. The bearing capacity of soils varies from 1.0 to 2.5 kg/cm2 and presents a seismic amplification of 1.0 to 2.0, with certain small areas where the seismic amplification reaches 2.5.
The preponderance of average buildings vulnerability of study area conditioned that seismic risk studies show that there is a prevalence of 61% in buildings that would suffer strong or severe damage after the occurrence of a rare or design earthquake (Tr = 475 years). Also, some buildings could collapse. The buildings located in the peripheral areas and those in historic center are would suffer the most damage, this due to self-construction and the colonial buildings in deplorable states of conservation. Depending on the structural typology, confined masonry buildings could suffer great damage. In addition, adobe buildings would be the most damaged because they would have severe damage and 40.6% could collapse. As a final conclusion, these results are alarming and serve for both the government, community organizations and the population to take human actions, political actions and strategies at the government level that allow disaster mitigation and resilience.

