


 Inglés (pdf)
 Articulo en XML
 Referencias del artículo
 Enviar articulo por email
 Citado por SciELO
  Similares en
SciELO
Similares en
SciELO 
 Permalink
1. INTRODUCTION
Adobe is one of the oldest materials used in construction. Structures built hundreds of years ago are still used today, although they present some damages, they remain stable.
Blondet et al.11 carried out dynamic tests on a shaking table to some typical adobe modules to evaluate their seismic behavior. The geometry of these specimens was stablished to represent adobe dwellings, with aspect ratios close to 1. However, there is no evidence of work on adobe buildings with low aspect ratios describing their seismic behavior in Peru. Adobe buildings such as the Kuño Tambo church and the San Juan Bautista de Huaro church, both located in the city of Cusco, have long walls; it results in aspect ratios much smaller than 1. Moreover, the adobe buildings of the Dos de Mayo National Hospital, located in the city of Lima, have similar characteristics: its walls are six meters of height and over fifty meters of length, resulting in an aspect ratio (H/L) of 0.12, approximately.
On the other hand, in recent decades, models applied to masonry structures have been developed based on the stress-strain relations of the material and damage factors. These models have been used to represent adobe structures corroborated with experimental test results. This article considers numerical models to study the seismic behavior of buildings with different aspect ratios and their damage patterns.
In addition, quakes recorded in Lima City are composed by predominant high-frequency band which are very close to the predominant natural frequency of the target buildings studied in this article.
2. BACKGROUND
In 2005, Zavala and Igarashi4 carried out experimental tests on four full-scale adobe walls with a monotonic static load. The objective of these tests was to evaluate the in-plane seismic behavior of the walls. After the test, these walls were repaired with mortar and then reinforced to be tested the same way.
Tarque14 describes the seismic behavior of adobe constructions through finite element models, using experimental tests of walls with cyclic loading11; where the Concrete damaged plasticity model was applied to represent the adobe material. The mechanical properties of the adobe masonry were calibrated to match well with the cyclic response of the adobe wall and its crack pattern evolution. After verification of the results, it was preliminary concluded that a continuous model could be used for adobe masonry.
Solis et al.13 conducted experimental tests to study the bending behavior of adobe walls. This study proposed analytical models to reproduce the behavior observed in the tests by comparing the moment-curvature diagrams. In addition, geogrids were used as reinforcement element on both faces of walls to obtain an improvement of their strength and their ductility.
Otero 0 conducted environmental vibration tests in a historic adobe building of the Dos de Mayo National Hospital. Estimation of their materials properties were conducted based on calibrations of the numerical model of this structure with the observed vibrations records. Also, it was observed that the global influence of the wooden roof system on the seismic behavior of adobe walls is of little significance; and the wooden roof system can be neglected in the numerical model.
3. REVIEW OF EXISTING DATA
The mechanical properties of the material are obtained from collected experimental tests. However, the properties may change site and time conditions implying the conduction of specific experimental tests for each case. It is difficult to determine the properties of each material. However, average values of material properties can be used such that most likely case. In this sense, parameters that represent the inelastic behavior are adjusted to correlate the damage patterns observed in real cases.
Fig. 1 shows the values of modulus of elasticity and maximum compressive stress obtained or used by different authors:
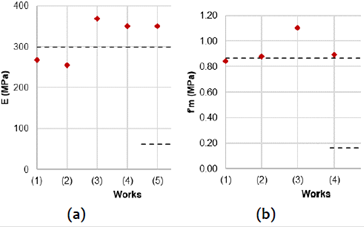
Fig. 1 (a) Modulus of elasticity (E) and (b) Maximum compressive stress (f’m) obtained by different authors: (1) Zavala & Igarashi4. (2) CEETyDES & JICA5. (3) Solis et al.13 (4) Invancic et al.15 (5) Noel12 (6) Standard E080-2017 17.
It is observed in Fig. 1 that the values of modulus of elasticity and maximum compressive stress are close to the average value (E=318 MPa, f’m=0.87). These values are used for numerical modeling of adobe buildings with different geometry conditions.
4. NUMERICAL MODELS
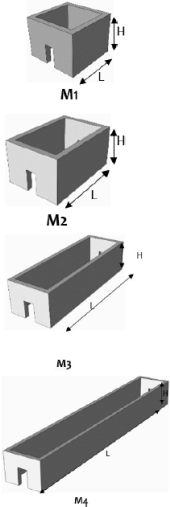
Finite element models were elaborated to study the influence of the aspect ratio on the seismic behavior of adobe buildings. Four models of adobe buildings with constant height and thickness are constructed by setting 4 height-length aspect ratios (H/L), namely: 0.75, 0.50, 0.25 and 0.12.
TABLE I shows the dimensions of the longitudinal walls of the four proposed buildings, with their respective aspect ratios:
TABLE I Dimensions of the longitudinal walls of the proposed buildings
| Model | L (m) | H (m) | Aspect ratio (H/L) |
|---|---|---|---|
| M1 | 8 | 6 | 0.75 |
| M2 | 12 | 6 | 0.50 |
| M3 | 24 | 6 | 0.25 |
| M4 | 52 | 6 | 0.12 |
L: Wall length
H: Wall height
The height and thickness of the walls remain constant for all four models, similar to the dimensions of the adobe buildings of the Dos de Mayo National Hospital. The transverse walls of the buildings have doors opening of the building. Fig.2 shows a schematic of the four building models:
The four-building models were analyzed using non-linear time-history analysis. The earthquake records used are the North-South and East-West components of the records shown in TABLE II:
TABLE II Seismic records used for dynamic analysis
| Record | Date | Station |
|---|---|---|
| “Lima y Callao” | 17/10/1966 | “Parque de la Reserva” |
| “Huaraz” | 31/05/1970 | “Parque de la Reserva” |
| “Lima” | 03/10/1974 | “Parque de la Reserva” |
The acceleration records shown in the table above were obtained from the REDACIS platform of CISMID FIC UNI.
The earthquake was applied in the two main directions of analysis simultaneously. The component that contained the larger peak ground acceleration (PGA) was applied perpendicular to the long wall of the building to obtain the most unfavorable scenario.
The records were scaled according to the procedure described in the NTE-E030 2018 standard (with the parameters Z4 and S1). It should be noted that the design spectrum and the calculated response spectra were modified to obtain spectra for a damping factor of 8%.
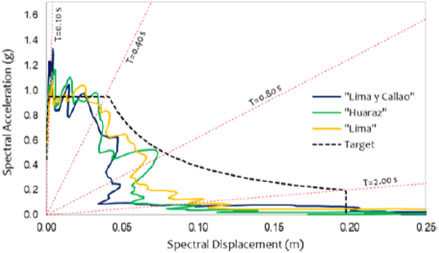
The scaled earthquake records used for the non-linear time-history analysis are shown in Fig. 3, Fig. 4 y Fig. 5. In order to reduce the computation time in the numerical simulations, the extreme sections of the seismic records were ignored until reaching amplitudes greater than 0.03g.
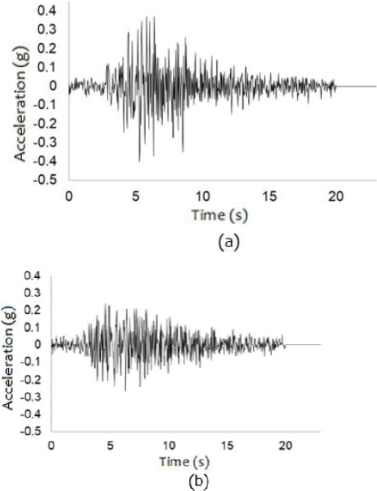
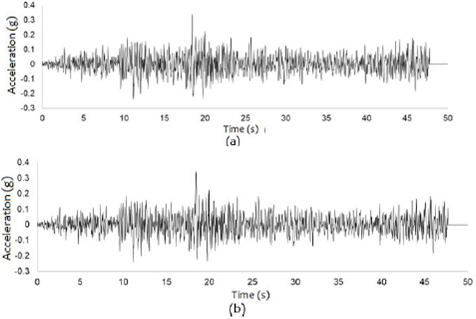
Fig. 5 shows the response spectra respect to the maximum spectral acceleration and the maximum spectral displacement corresponding to the three scaled earthquake records and the target spectrum used for scaling:
The finite element models were created in the "Abaqus" program. The continuous model Concrete Damaged Plasticity was used to represent the adobe material. The solid element type C3D8 was used to represent the adobe walls, with a hexahedral mesh of 100x100x100 millimeters.
The wooden roof was not modeled following the recommendations given in 0, but its weight was represented as a uniformly distributed load on the upper face of the adobe walls.
The properties of the materials used for modeling are as follows: The modulus of elasticity of adobe is 300 MPa, obtained from the calibrations carried out by Tarque14; the maximum compressive stress is 0.87 MPa, obtained from the mean value calculated in section 3; the maximum tensile stress is usually estimated between 5% and 10% of the maximum compressive stress; a mean value equal to 7% (0.06 MPa) is considered; the tensile breaking energy is 0.01 N / mm, obtained from the calibrations carried out by Tarque14. TABLE III show a summary of the properties of the material used for modeling:
TABLE III Material properties for the adobe masonry
| Material | E (MPa) | ν | f’m (MPa) | f’t (MPa) | Gf (N/mm) |
|---|---|---|---|---|---|
| Adobe | 300 | 0.20 | 0.888 | 0.06 | 0.01 |
| Timber | 5500 | 0.40 | - | - | - |
E: Elasticity modulus
ν: Poisson modulus
f’m: Maximum compression stress
f’t: Maximum tensile stress
Gf: Fracture energy in tensión
The tensile damage factors used for the adobe are the values obtained by Tarque14 and are shown in TABLE IV, and the stiffness recovery parameters used for the adobe are the values obtained by Otero 0 and are shown in TABLE V:
TABLE IV Tensile damage factors for the adobe masonry
| dt | Plastic displacement (mm) |
|---|---|
| 0.00 | 0.00 |
| 0.85 | 0.125 |
| 0.90 | 0.250 |
| 0.95 | 0.500 |
dt: Tensile damage factors
TABLE V Stiffness recovery for the adobe masonry
| Wc | Wt |
|---|---|
| 0.3 | 0.0 |
Wc: Stiffness recovery for compression
Wt: Stiffness recovery for tension
An explicit analysis was used, an ideal integration scheme in models with rapid material degradation (such as quasi-brittle materials). In explicit analysis, the equations of motions are integrated using the central difference integration rule, which is conditionally stable. The stability limit for this integration rule is approximatively equal to the time for a wave to cross the smallest element dimension in the model. In this sense, A time increment of 2.3793 x 10⁻⁵s is maintained during all the analyses.
5. RESULTS
5.1. Model M1
Fig. 7 Show the fundamental vibration modes in the direction of the Y axis. The first vibration mode involves 48.48% of the total mass.
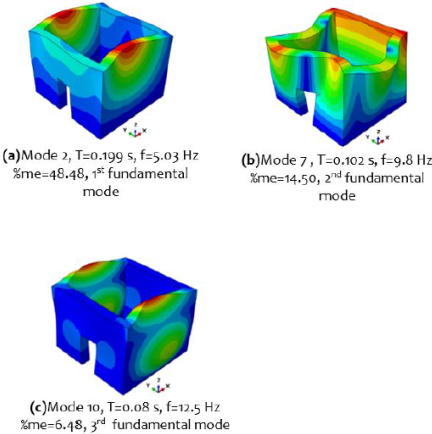
Fig. 8, Fig. 9 y Fig. 10 show the mechanisms of plastic strains subjected to base acceleration input corresponding to the seismic record of Lima and Callao, Huaraz, and Lima, respectively:
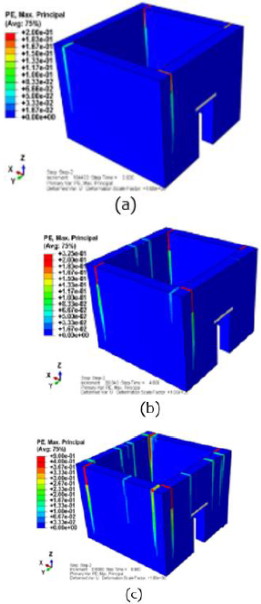
Fig. 8 Plastic strains in Model 1 corresponding to the seismic of “Lima y Callao”. (a) t=3.92s (b) t=4.8s (c) t=8.98s
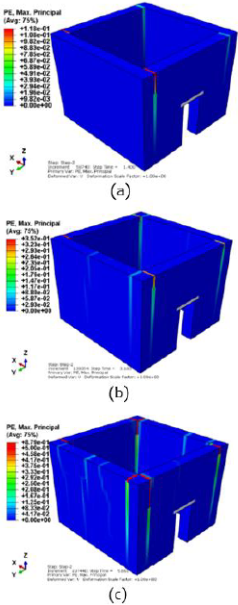
Fig. 9 Plastic strains in Model 1 corresponding to the seismic of “Huaraz”. (a) t=1.40s (b) t=3.10s (c) t=5.66s
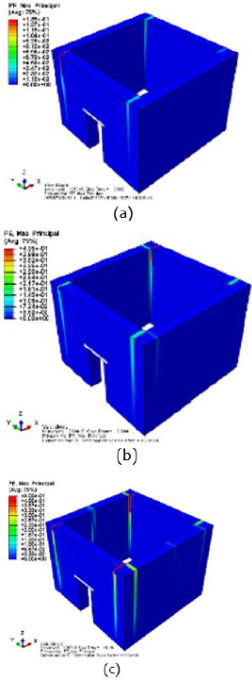
Fig. 10 Plastic strains in Model 1 corresponding to the seismic of “Lima”. (a) t=3.0s (b) t=7.0s (c) t=10.46s
Following is a brief description of the three cracking patterns identified in the numerical simulations:
1er pattern: Vertical cracks in the corners of the building due to axial and bending stresses.
2nd pattern: Vertical cracks in the upper center of the walls and extend to the bottom due to bending stress.
3rd pattern: Horizontal cracks at the base of the walls due to axial and bending stresses.
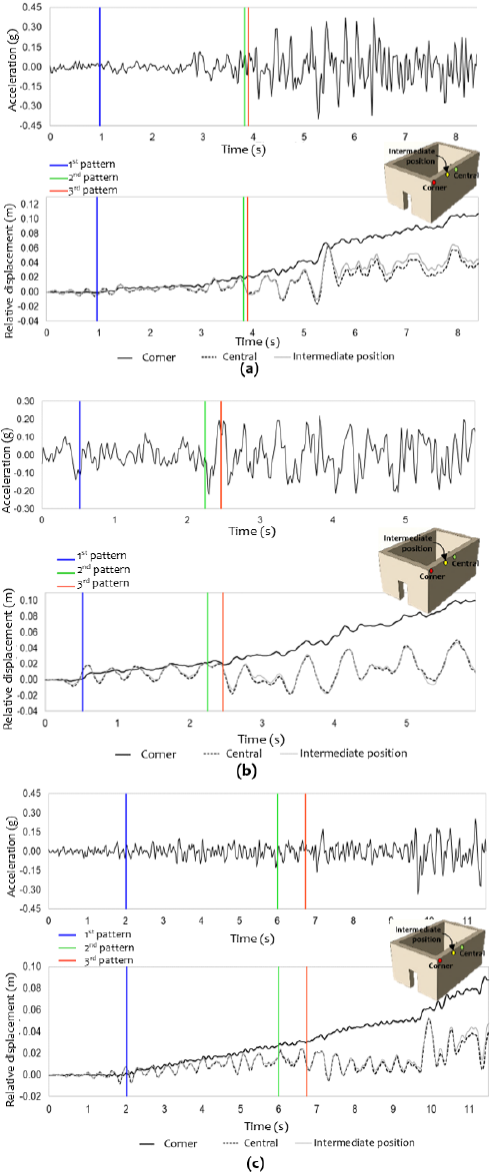
Fig. 11 show the history of relative displacements of two nodes located at the top of the walls with respect to the base; the first node located in the corner of the building and the second node located in the central part of the wall, near the place where the second cracking pattern is formed. The blue, green, and red vertical lines are the beginning of the first, second, and third cracking patterns, respectively.
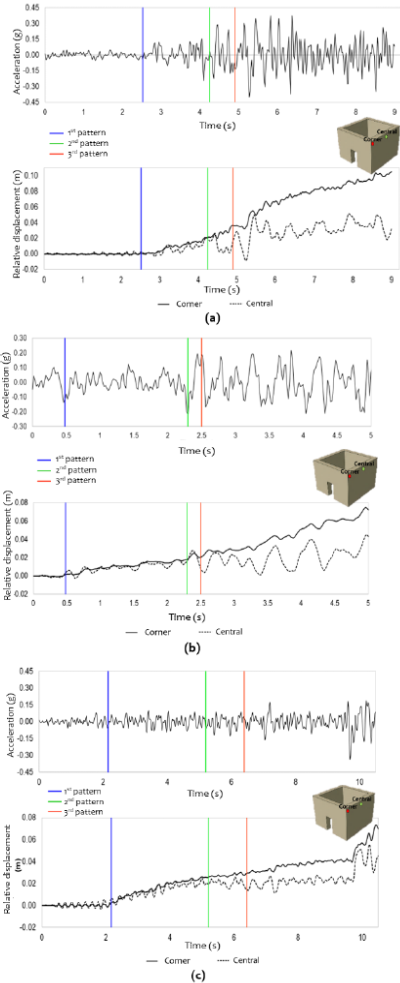
Fig. 11 Base acceleration and history of relative displacements of two nodes located at the top of the walls corresponding to the seismic of: (a) “Lima y Callao” (b) “Huaraz (c) “Lima”. Model M1
In the previous figures, it can be observed that the first pattern (vertical corner cracks) appears for ground accelerations close to 0.10 G, and that the third cracking pattern occurs for accelerations close to 0.20 G.
In the first three seconds, the largest displacements occur in the upper central part of the longitudinal wall. Then, as the plastic deformations increase, residual deformations appear in the corners that increase over time. Consequently, the displacements in the corners eventually become greater than the displacements of the central part of the wall.
The wall shear actions of the transverse wall due to in-plane effects are also analyzed. The shear force history at the base of the transverse wall and the relative displacements of a node located at the top of the transverse wall with respect to the base are extracted from the numerical model.
The shear force and displacement history are discretized in 20 equal time intervals. Then, the maximum force and displacement values are captured in each interval. Finally, the shear force at the base (Vtw) is divided by the weight of the transverse wall (Ptw) and the relative displacement is divided by the height of the floor. The curve "seismic coefficient (Vtw⁄ Ptw) vs. drift" is obtained (see Fig. 12). The blue, green, and red vertical lines are the beginning of the first, second, and third cracking patterns, respectively.
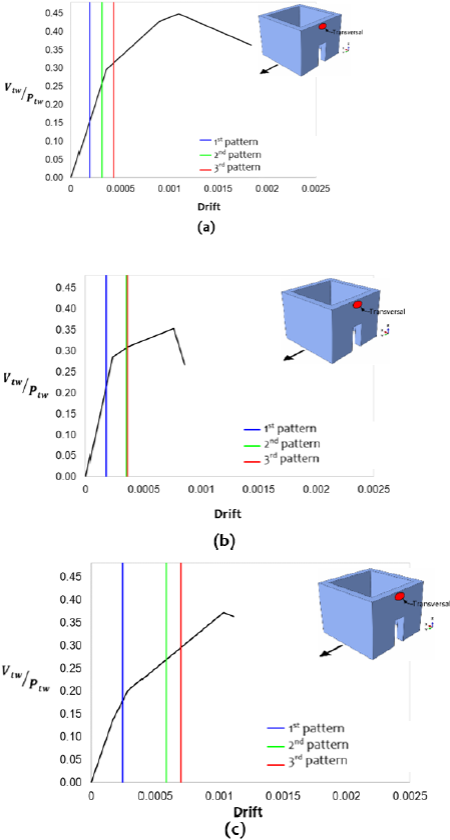
Fig. 12 Vtw⁄Ptw vs Drift curve for the transverse wall due to in-plane effects, corresponding to the seismic of: (a) “Lima y Callao”. (b) “Huaraz”. (c) Lima de 1974. Model M1
In the tests carried out by Zavala & Igarashi4, the maximum drift obtained was 0.004. In the curves shown in Fig. 12, the maximum distortion when the third cracking pattern occurs (last to appear) is less than 0.002. It can be concluded that bending failures are generally the first to appear while shear failures caused by actions in-plane of the wall are the last to occur.
5.2. Model M2
Fig. 13 show the fundamental vibration modes in the direction of the Y axis. The first vibration mode involves 41.57% of the total mass.
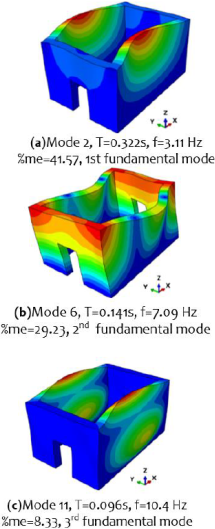
Fig. 14, Fig. 15, and Fig. 16 show the mechanisms of plastic strains subjected to base acceleration input corresponding to the seismic record of Lima and Callao, Huaraz, and Lima, respectively:
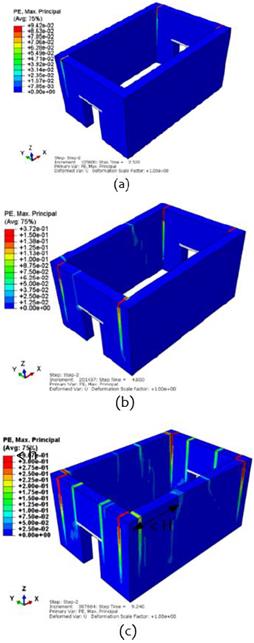
Fig. 14 Plastic strains in Model 3 corresponding to the seismic of “Lima y Callao”. (a) t=2.52s (b) t=4.8s (c) t=9.24s.
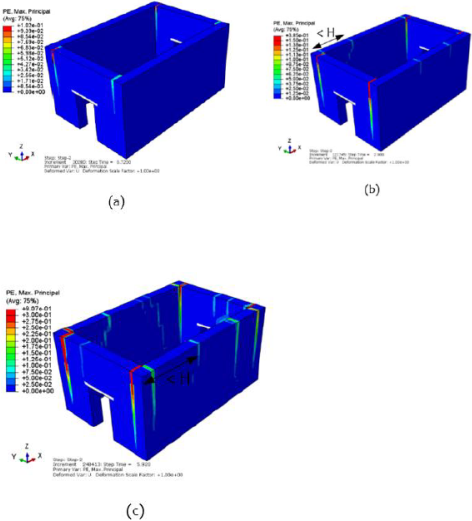
Fig. 15 Plastic strains in Model 2 corresponding to the seismic of “Huaraz”. (a) t=0.72s (b) t=2.90s (c) t=5.92s
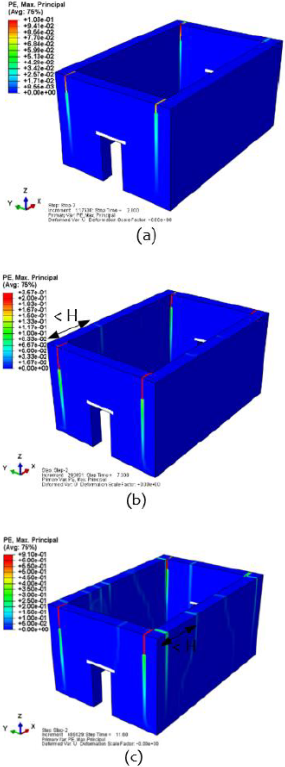
Fig. 16 Plastic strains in Model 2 corresponding to the seismic of “Lima”. (a) t=2.8s (b) t=7.0s (c) t=11.6s
Following is a brief description of the three cracking patterns identified in the numerical simulations:
1er pattern: Vertical cracks in the corners of the building due to axial and bending stresses.
2nd pattern: Vertical and diagonal cracks in longitudinal walls at a horizontal distance slightly less than wall height (H) measured from a corner of the building.
3rd pattern: Horizontal cracks at the base of the walls due to axial and bending stresses.
Fig. 17 show the history of relative displacements of three nodes located at the top of the longitudinal wall with respect to the base; the first node located in the corner of the building, the second node located in the central part of the wall, and the third node at a horizontal distance slightly less than wall height (near the place where the second cracking pattern is formed). The blue, green, and red vertical lines are the beginning of the first, second, and third cracking patterns, respectively.
In the previous figures, it can be observed that the first pattern (vertical corner cracks) appears for ground accelerations close to 0.10 G, and that the third cracking pattern occurs for accelerations close to 0.15 G.
In the first three seconds, the largest displacements occur in the upper central part of the longitudinal wall. Then, as the plastic deformations increase, residual deformations appear in the corners that increase over time. Consequently, the displacements in the corners eventually become greater than the displacements of the central part of the wall.
5.3. Model M3
Fig. 18 show the fundamental vibration modes in the direction of the Y axis. The first vibration mode involves 38.98% of the total mass.
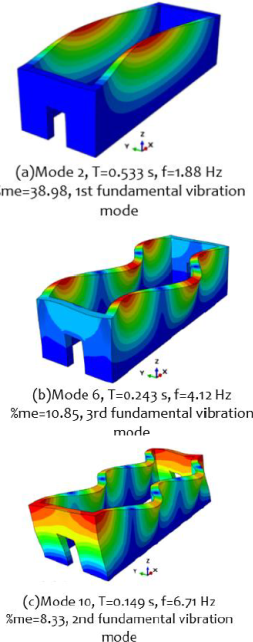
Fig. 19, Fig. 20, and Fig. 21 show the mechanisms of plastic strains subjected to base acceleration input corresponding to the seismic record of Lima and Callao, Huaraz, and Lima, respectively:
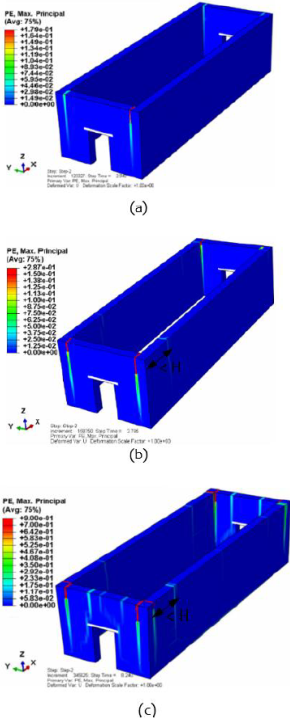
Fig. 19 Plastic strains in Model 3 corresponding to the seismic of “Lima y Callao”. (a) t=2.94s (b) t=3.78s (c) t=8.24s
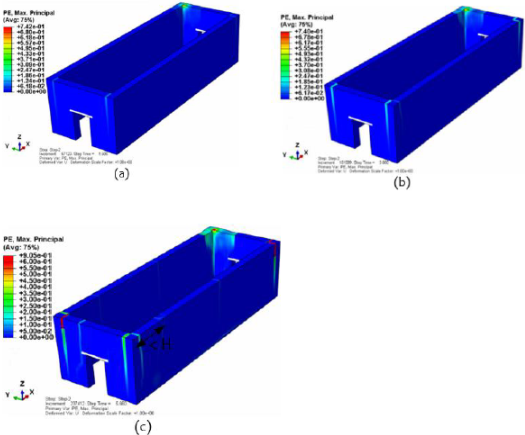
Fig. 20 Plastic strains in Model 3 corresponding to the seismic of “Lima y Callao”. (a) t=1.60s (b) t=3.60s (c) t=5.66s.
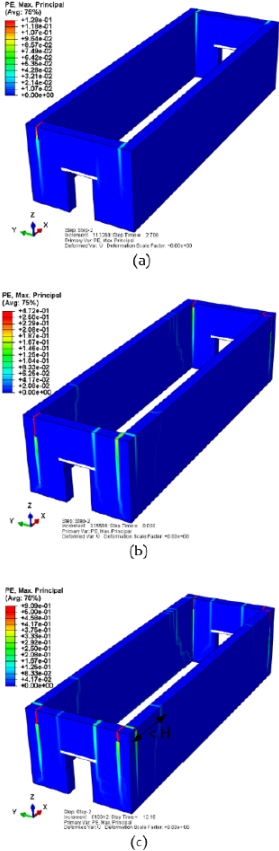
Fig. 21 Plastic strains in Model 3 corresponding to the seismic of “Lima y Callao”. (a) t=2.7s (b) t=8.0s (c) t=12.16s
Following is a brief description of the three cracking patterns identified in the numerical simulations:
1er pattern: Vertical cracks in the corners of the building due to axial and bending stresses.
2nd pattern: Horizontal cracks at the base of the walls due to axial and bending stresses.
3rd pattern: Vertical and diagonal cracks in longitudinal walls at a horizontal distance slightly less than wall height (H) measured from a corner of the building.
Fig. 22 show the history of relative displacements of three nodes located at the top of the longitudinal wall with respect to the base; the first node located in the corner of the building, the second node located in the central part of the wall, and the third node at a horizontal distance slightly less than wall height (near the place where the third cracking pattern is formed). The blue, green, and red vertical lines are the beginning of the first, second, and third cracking patterns, respectively.
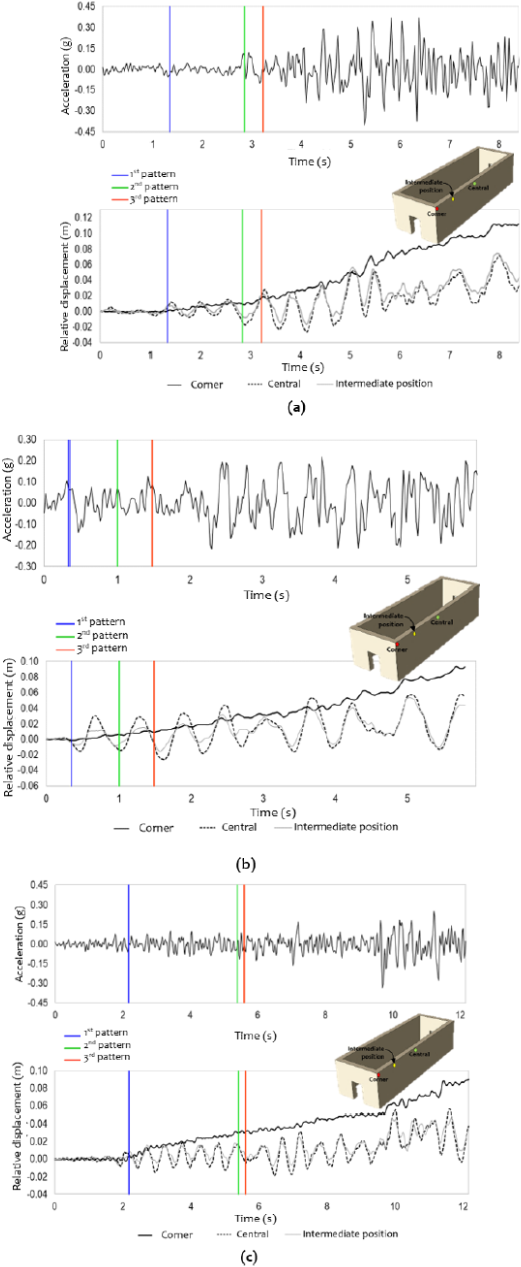
Fig. 22 Base acceleration and history of relative displacements of three nodes located at the top of the walls corresponding to the seismic of: (a) “Lima y Callao” (b) “Huaraz (c) “Lima”. Model M3
In the previous figures, it can be observed that the first pattern (vertical corner cracks) appears for ground accelerations close to 0.08 G, and that the third cracking pattern occurs for accelerations close to 0.14 G.
In the first four seconds, the largest displacements occur in the upper central part of the longitudinal wall. Then, as the plastic deformations increase, residual deformations appear in the corners that increase over time. Consequently, the displacements in the corners eventually become greater than the displacements of the central part of the wall.
5.4. Model M4
Fig. 23 show the fundamental vibration modes in the direction of the Y axis. The first vibration mode involves 41.89% of the total mass.
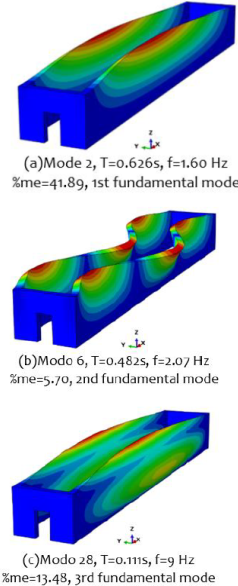
Fig. 24, Fig. 25, and Fig. 26 show the mechanisms of plastic strains subjected to base acceleration input corresponding to the seismic record of Lima and Callao, Huaraz, and Lima, respectively:
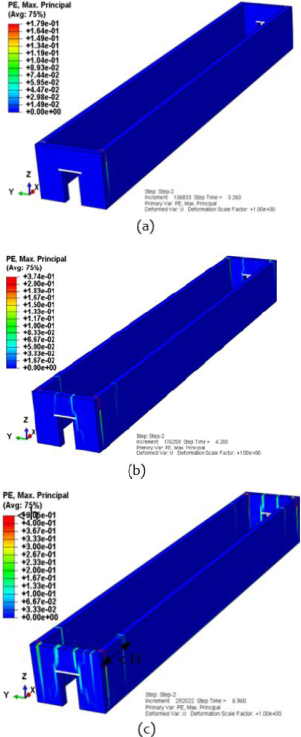
Fig. 24 Plastic strains in Model 3 corresponding to the seismic of “Lima y Callao”. (a) t=3.26s (b) t=4.20s (c) t=6.96s
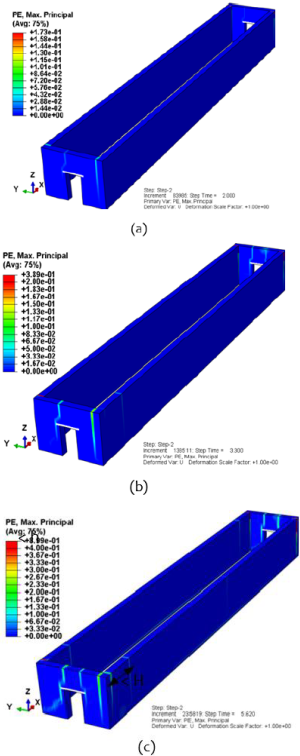
Fig. 25 Plastic strains in Model 3 corresponding to the seismic of “Huaraz”. (a) t=2.0s (b) t=3.30s (c) t=5.62s
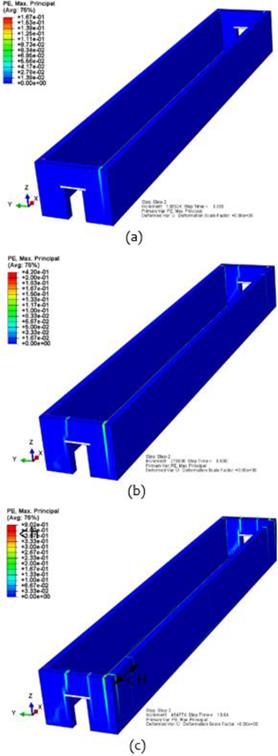
Fig. 26 Plastic strains in Model 3 corresponding to the seismic of “Lima”. (a) t=3.30s (b) t=6.60s (c) t=10.84s.
Following is a brief description of the three cracking patterns identified in the numerical simulations:
1er pattern: Vertical cracks in the corners of the building due to axial and bending stresses.
2nd pattern: Horizontal cracks at the base of the walls due to axial and bending stresses.
3rd pattern: Vertical and diagonal cracks in longitudinal walls at a horizontal distance slightly less than wall height (H) measured from a corner of the building.
Fig 27 show the history of relative displacements of three nodes located at the top of the longitudinal wall with respect to the base; the first node located in the corner of the building, the second node located in the central part of the wall, and the third node at a horizontal distance slightly less than wall height (near the place where the third cracking pattern is formed). The blue, green, and red vertical lines are the beginning of the first, second, and third cracking patterns, respectively.
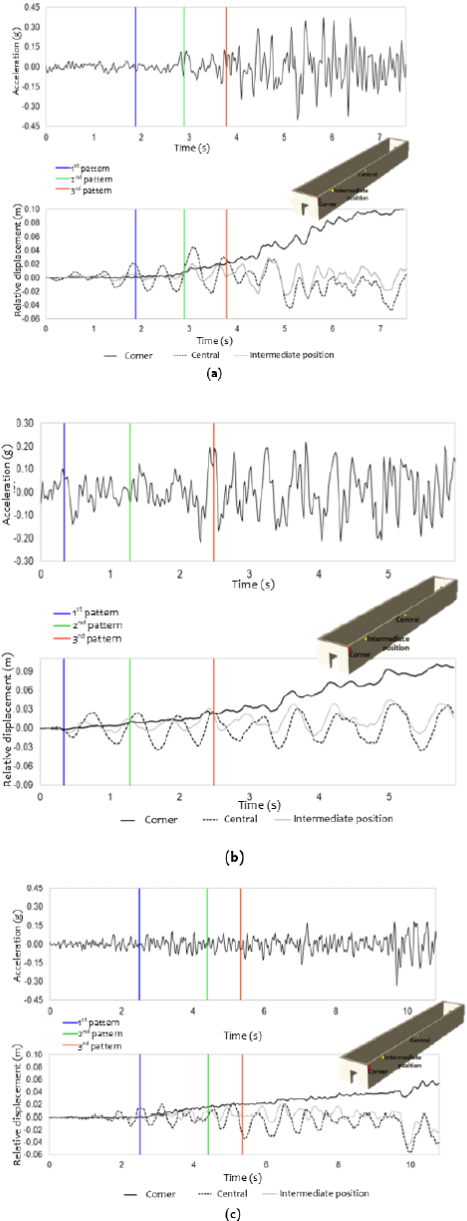
Fig. 27 Base acceleration and history of relative displacements of three nodes located at the top of the walls corresponding to the seismic of: (a) “Lima y Callao” (b) “Huaraz (c) “Lima”. Model M4
In the previous figures, it can be observed that the first pattern (vertical corner cracks) appears for ground accelerations close to 0.08 G, and that the third cracking pattern occurs for accelerations close to 0.13 G.
In the first three seconds, the largest displacements occur in the upper central part of the longitudinal wall. Then, as the plastic deformations increase, residual deformations appear in the corners that increase over time. Consequently, the displacements in the corners eventually become greater than the displacements of the central part of the wall.
5.5. ANALYSIS OF RESULTS
In the M1 model, characterized by having short walls, vertical cracks are formed in the center of the wall. In the M2, M3, and M4 models characterized by having long walls, the cracks occur at a horizontal distance slightly less than wall height (H) measured from a corner of the building.
In models M1 and M2, cracks at the wall base occur in the final stage of the simulation (third pattern). By contrast, in models M3 and M4 (buildings with very long walls) cracks at the wall base occur immediately after the corner cracks (second pattern).
The Peruvian standard NTE-E080 limits the dimension of an adobe wall through the expression (1):

Where λh is the horizontal slenderness (H/h) and λv is the vertical slenderness (L/h).
TABLE VI shows the values calculated using the expression (1) for the four models studied. Only with the model M1 is a value lower than the limit obtained, while for the models M1, M2, and M4 the value obtained exceed the limit.
TABLE VI Slenderness factor for longitudinal adobe walls
| Model | h (m) | H (m) | L (m) | λh | λv | λh+1.25 λv |
|---|---|---|---|---|---|---|
| M1 | 0.80 | 6 | 8 | 7.5 | 8 | 17.4 |
| M2 | 0.80 | 6 | 12 | 7.5 | 13 | 22.4 |
| M3 | 0.80 | 6 | 24 | 7.5 | 30 | 39.4 |
| M4 | 0.80 | 6 | 52 | 7.5 | 65 | 74.4 |
h: Wall thickness
L: Wall length
H: Wall height
λh: Horizontal slenderness (H/h)
λv: Vertical slenderness (L/h)
Fig. 28 shows the capacities of the four buildings studied in terms of the seismic coefficient (basal shear divided by the weight of the building), with their respective slenderness factors shown in Table 4.24. The figure shows three points for each model. Each point corresponds to an earthquake record of the three considered (Lima and Callao of 1966, Huaraz of 1970, and Lima of 1974). The gray dashed line joins the calculated average values with these three points. It can be observed that the seismic capacity decreases considerably from the M1 model to the M2 model, just before the slenderness limit value established by the NTE-E080 standard. In addition, the estimated value of seismic capacity without considering the influence of aspect ratio (M1 model) can reach around 1.5 times the value considering the influence of aspect ratio (M4 model).
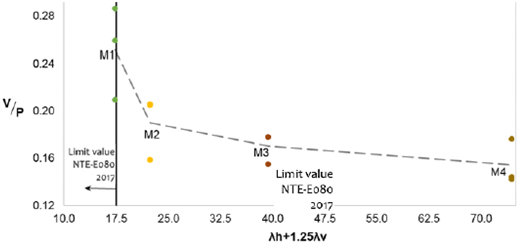
It can be concluded that the walls of new adobe constructions must have a slenderness factor lower than the established limit value. If this limit is exceeded, there will be an abrupt drop in seismic capacity.
5.6. DISCUSSION OF RESULTS
The results obtained in the numerical models are compared with the evidence of damage caused by past earthquakes. Results of numerical modeling are compared with the identified damage pattern.
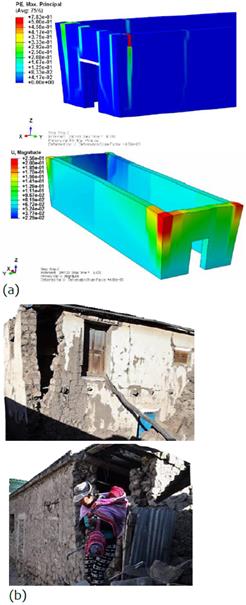
As observed in the cracking process, extensive vertical cracks form in the corners of the building, which could cause the failure of the walls. (Fig. 29).
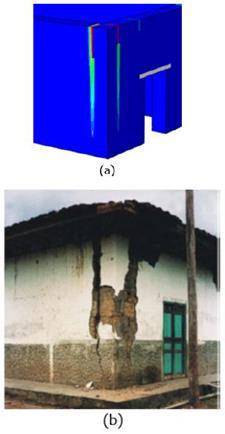
Fig. 29 Comparison of damages obtained in numerical simulations with real buildings (a) Plastic deformations in the numerical model (b) Damage to buildings due to past earthquakes by J. Kuroiwa8
The Colombian Association of Seismic Engineering presents in its "Manual for the rehabilitation of dwelling built with adobe and tapia wall" the most probable failure modes that can occur in buildings. They are classified into two types of walls: short walls and long walls. A comparison of the results obtained is shown below.
Fig. 30. shows a comparison between the damages obtained in the model M1 with the failure mode shown in the manual for short walls. The two images show vertical cracks at the corners and vertical cracks at the central part of the wall.
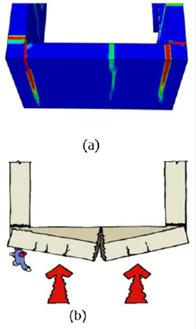
Fig. 30 Comparison of damages obtained corresponding to model M1. (a) Plastic deformations in the model M1 (b) The failure model for short walls by The Colombian Association of Seismic Engineering18.
Fig. 31 shows a comparison between the damages obtained in the model M2 with the failure mode shown in the manual for long walls. The two images show vertical cracks at the corners and diagonal cracks at a horizontal distance slightly less than wall height (H) measured from a corner of the building.
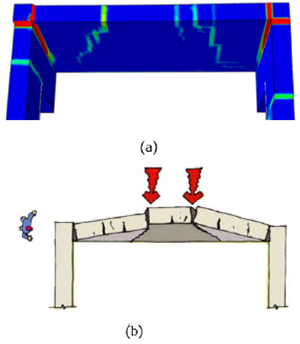
Fig.31. Comparison of damages obtained corresponding to model M2. (a) Plastic deformations in the model M1 (b) The failure model for long walls by The Colombian Association of Seismic Engineering18
Comparison with the results of the numerical models shows good consistency with the failure modes described in the manual.
Vertical cracks appear at the corners of the wall causing the adobe blocks in that area to break and fall (See Fig. 32).
CONCLUSIONS
The damage patterns in adobe buildings can be predicted using finite elements with the concrete plasticity model and damage macro model. However, the structural response should be considered until reach allowable limits, because the numerical model by finite element method does not simulate the physical separation between the walls beyond the allowable limits.
The first cracking pattern in the four buildings analyzed is formed in the corners due to axial and flexural stresses. These vertical cracks appear for ground accelerations close to 0.10 G.
In long walls, the second cracking pattern occurs at the base, and the third cracking pattern occurs in the longitudinal wall, at a horizontal distance slightly less than wall height (H) measured from a corner of the building.
The slenderness limit value established by the E080-2017 standard will prevent new adobe constructions have walls with small aspect ratios (long walls).
The aspect ratio of the wall of adobe buildings is highly predominant for large values of slenderness factor. When the influence of the aspect ratio is neglected in this kind of buildings, seismic capacity is overestimated. The estimated value of seismic capacity without considering the influence of aspect ratio can reach around 1.5 times the value considering the influence of aspect ratio. Therefore, evaluation of seismic vulnerability and rehabilitation proposals must consider the influence of the aspect ratios.

